This comprehensive section analyzes temperature trends throughout the year using several visualizations:
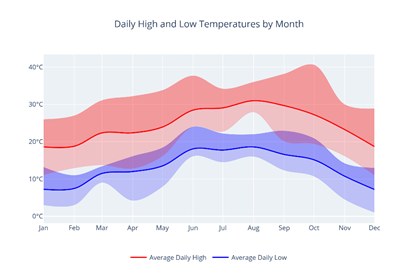
• Daily High and Low Temperatures by Month: Displays the statistical max, mean, and min daily temperatures
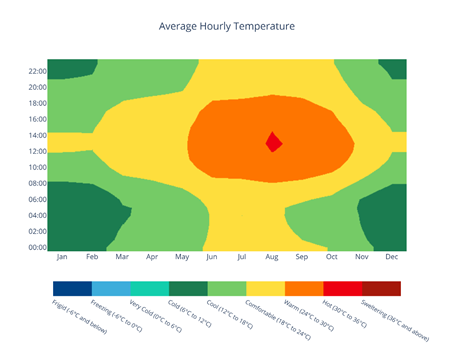
• Average Hourly Temperature: A "carpet plot" showing temperature for each hour of the day averaged across each month, color-coded from Frigid to Sweltering
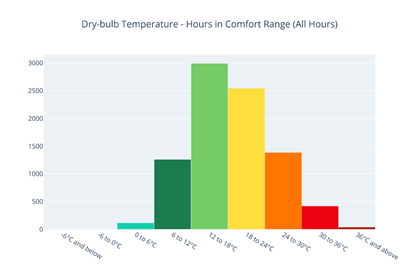
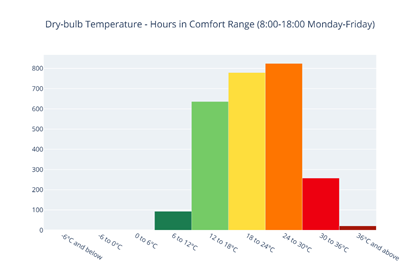
• Dry Bulb Temperature Range Analysis: Bar charts detail the number of hours and percentage of time spent in different temperature bands for both all hours and typical occupied hours (8:00-18:00 Monday-Friday). These typical occupied hours are pre-defined and fixed. Customized hour ranges can be obtained from VistaPro and the design model if warranted.
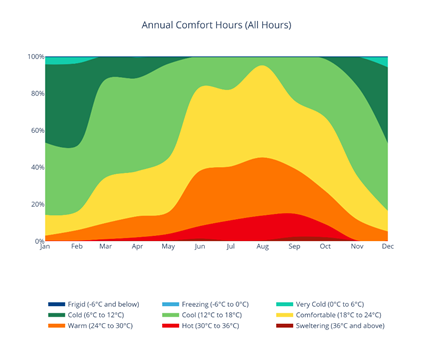
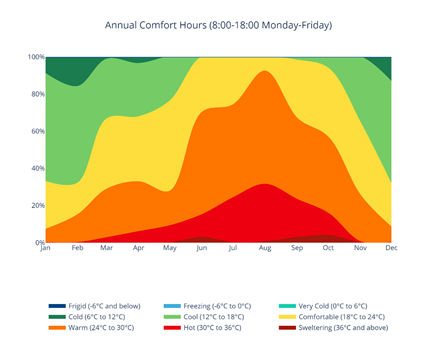
• Comfort Range Analysis: Area graphs detail the number of hours and percentage of time spent in different comfort bands (e.g., "Cool," "Comfortable," "Warm") for both all hours and occupied hours (8:00-18:00 Monday-Friday). These typical occupied hours are pre-defined and fixed. Customized hour ranges can be obtained from VistaPro and the design model if warranted.
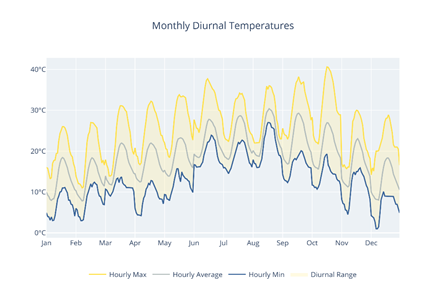
• Monthly Diurnal Temperatures: Illustrates the diurnal swing (variation over a single day) for each month
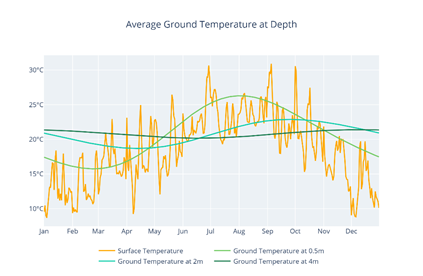
• Average Ground Temperature at Depth: Displays predicted temperatures at 0.5m, 2m, and 4m depths using the Xing two-harmonic model
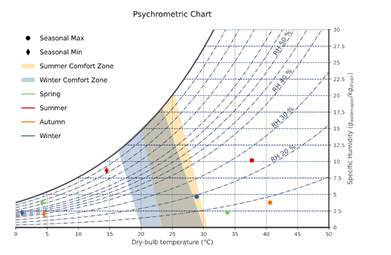
• Psychrometric Chart: Shows the physical and thermodynamic properties of moist air, including seasonal comfort zones based on ASHRAE Standard 55