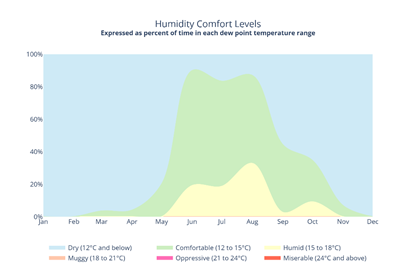
This section evaluates moisture levels in the air:
• Humidity Comfort Levels: An area chart expressing the percentage of time spent in various dew point ranges, from Dry to Miserable
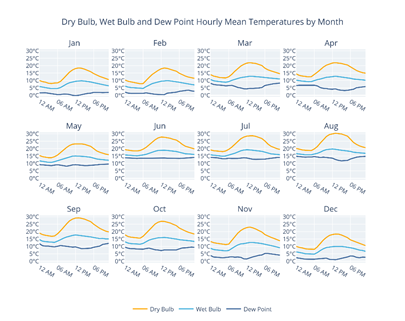
• Hourly Mean Temperatures by Month: Small-multiple line charts showing the relationship between Dry Bulb, Wet Bulb, and Dew Point hourly means for every month