Simulations, Cost & Results
Simulations
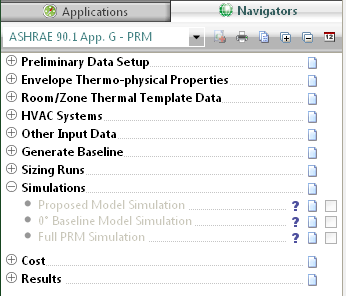
Figure 43 - Simulations Tasks
Proposed Model Simulation
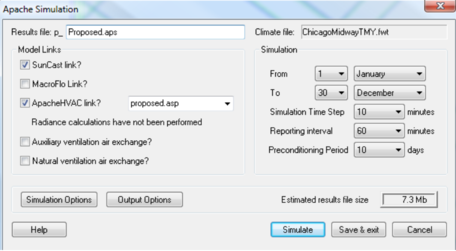
This step allows the user to set up a full annual simulation for the proposed model. Ensure that the correct model links and the correct Apache HVAC file are selected. Ensure that the simulation time is set from 1st Jan – 31st Dec.
0° Baseline Model Simulation
This step will automatically run a full annual simulation for the 0o baseline model.
Full PRM Simulation
This step will run a full annual simulation for the proposed and all four baseline models. The user is required to set up data relating to the proposed simulation. The four baseline simulations are run automatically.
Macroflo & the PRM navigator
In order to link the VE Macroflo module into the PRM navigator users must first run the “Full PRM simulation” with the Macroflo link ticked off. Once the full simulation is complete users must then run the “Proposed model simulation” with the Macroflo link ticked on. The proposed simulation must be run again with the same simulation name so that it over writes the first proposed results file.
Cost
Please refer to the tariff analysis tool please refer to the "Tariff analysis" Section of this Help Site.
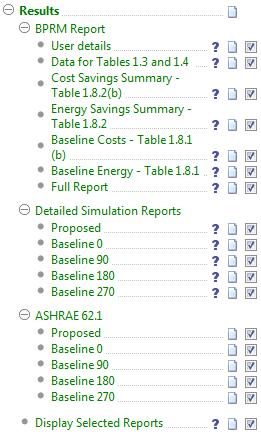
Results
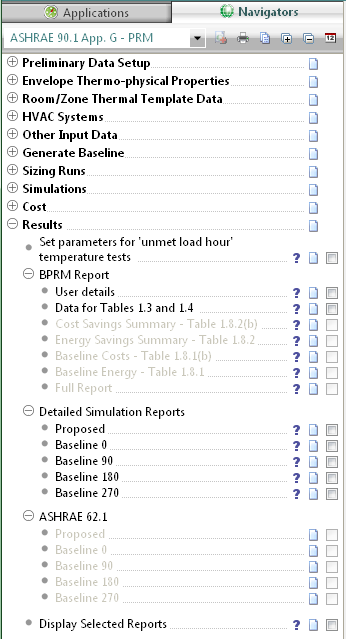
Figure 44 - Results Navigator Sub-categories and Tasks
Set Parameters For “Unmet Load Hour” Temperature Tests
Section G3.1.2.2 of ASHRAE 90.1 2007 states “ Unmet load hours for the proposed design or baseline building designs shall not exceed 300 (of the 8760 hours simulated), and unmet load hours for the proposed design shall not exceed the number of unmet load hours for the baseline building design by more than 50. If unmet load hours in the proposed design exceed the unmet load hours in the baseline building by more than 50, simulated capacities in the baseline building shall be decreased incrementally and the building re-simulated until the unmet load hours are within 50 of the unmet load hours of the proposed design. If unmet load hours for the proposed design or baseline building design exceed 300, simulated capacities shall be increased incrementally, and the building with unmet loads re-simulated until unmet load hours are reduced to 300 or less. Alternatively, unmet load hours exceeding these limits may be accepted at the discretion of the rating authority provided that sufficient justification is given indicating that the accuracy of the simulation is not significantly compromised by these unmet loads.”
The “unmet load hours” can be calculated in two different places in the VE:
1. From the PRM navigator “Unmet load hours report”
2. From the Range test dialog in Vista, using the heating & cooling set points, and the logical “OR” shared hours test. Currently, the user must click “Occupied hours only” as well.
See below detail for the above two approaches.
PRM Navigator “Unmet load hours”
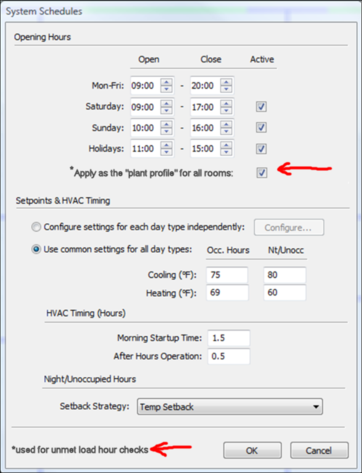
When using the PRM navigator the range of hours tested to meet the unmet load hour requirements are defined within the “system schedule” dialogue.
If “Apply as the ‘plant profile’ for all rooms” is left as ‘ticked’ then it will create a new annual profile named ‘Plant-conditioning times’ which will be assigned as the ‘Plant profile’ for all rooms. This profile will provide just two things to the actual unmet load hours test:
1. The opening hours, and thus a means of shifting the effective times that the times heating and cooling set points switch from Occ to Nt/Unocc set point values
2. The times for which the HVAC will actually be OFF (it is rare to allow this outside of very mild climates).
In other words, while modelling of the HVAC system operation needs to use the Occ set points over the larger number of hours that include warm-up and wind-down, the Unmet Load Hours test needs to use these more stringent set points over a shorter period of each day (just the opening hours) This test must assume the rest set points to be at the unoccupied values during the warm-up and wind-down. It should stop counting unmet load hours outside of occupied times only when the selected Setback Strategy is “HVAC Off”.
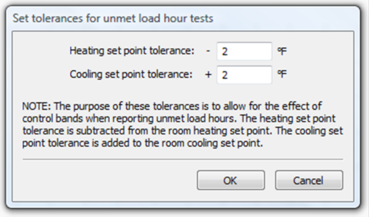
Once the above information has been set users are also prompted in a later navigator step to set tolerances for the unmet load hour check.
The purpose of these tolerances is to allow for the effect of control bands when reporting unmet load hours. The heating set point tolerance is subtracted from the room heating set point. The cooling set point is added to the room cooling set point.
Range test dialogue in Vista
It may be necessary to manually check the unmet load hours for models that do not have a common heating & cooling set point for all model spaces. This means that a manual approach must be implemented for spaces with common heating & cooling set points. ?
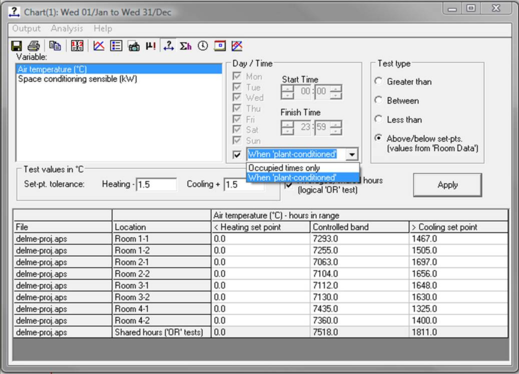
This manual approach uses the range test feature within the Vista results analysis tool to perform the unmet load hour’s check. Users must select the required model rooms or groups of rooms they wish to test & then select the range test icon in the main Vista results analysis tool bar. The below interface will appear:
Users must select the “when plant conditioned” from the above drop down window & set the heating cooling tolerance ranges before clicking the apply button. Once the “apply” button has been clicked the user will be presented with results.
Using this approach means that users will have to manually create the LEED results table 1.3 for submittal & that the automated result table 1.3 generated when the reportage button is activated is now redundant.
BPRM Report
BPRM results are presented in a format similar to the standard LEED letter template.
Initially user specified information is entered.
The Navigator then generates individual tables from within the report. Finally the BPRM report can be generated in full.
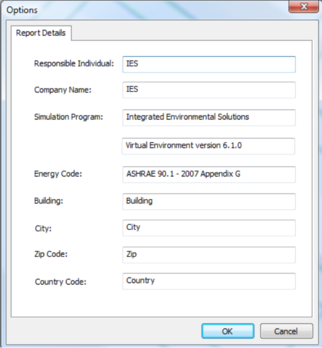
User Details
Input user details for use in the full BPRM report.
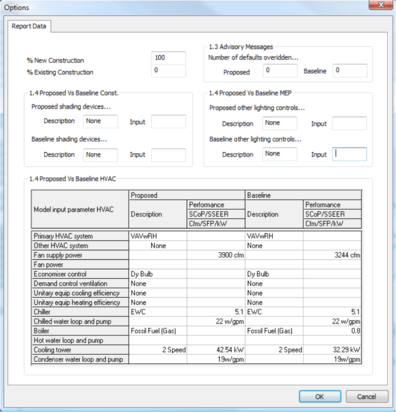
Data For Tables 1.3 and 1.4
Certain data relating to tables 1.3 and 1.4 has to be entered manually. Information entered here will be shown in the full BPRM report.
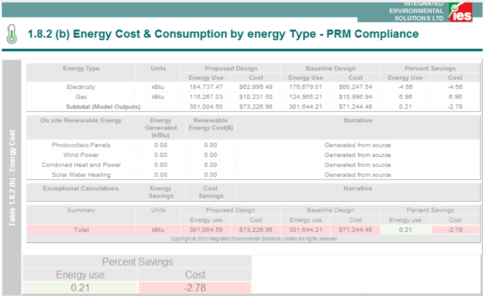
Cost Savings Summary – Table 1.8.2(b)
Table 1.8.2(b), the cost savings summary table, is presented.
Energy Savings Summary – Table 1.8.2
Table 1.8.2, the energy savings summary table, is presented.
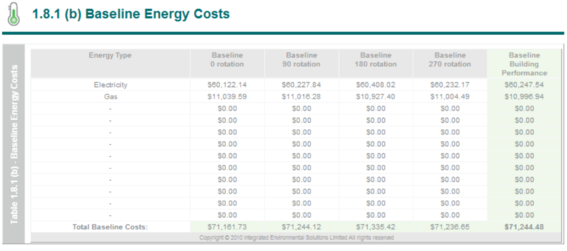
Baseline Costs – Table 1.8.1(b)
Table 1.8.1(b), the baseline costs table, is presented.
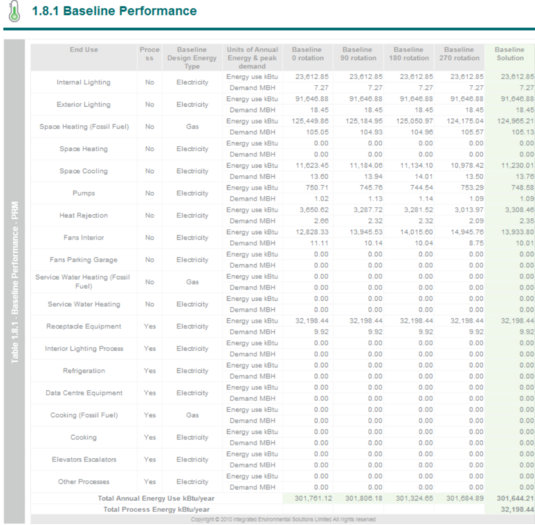
Baseline Energy – Table 1.8.1
Table 1.8.1, the baseline energy table, is presented.
Full Report
The full BPRM report is generated containing all the above tables, plus
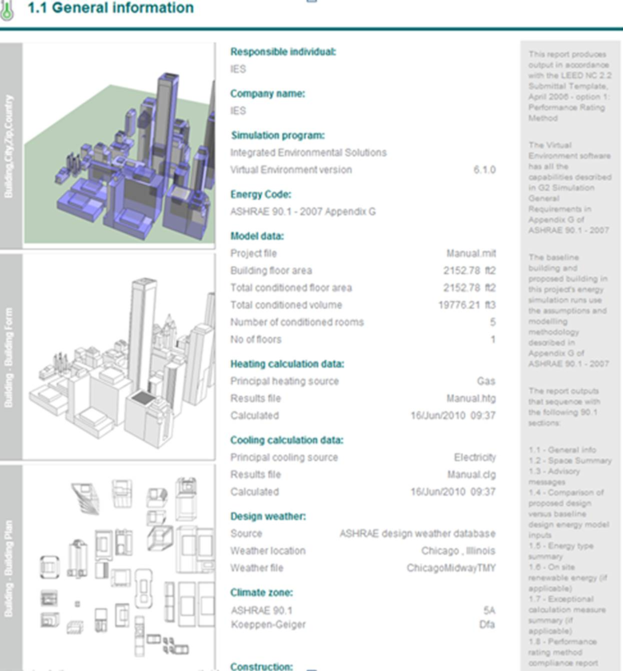
Table 1.1 - General Information
Report images can be replaced by:
1. Open model viewer
2. Adjust the model view accordingly
3. Save the image to the VISTA BPRM folder with the project Vista file, over write appropriate default BMP default file & regenerate report.
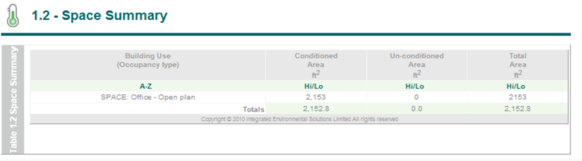
4. Table 1.2 – Space Summary
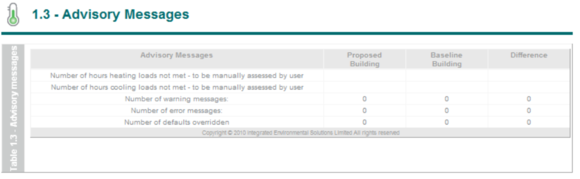
Table 1.3 – Advisory Messages
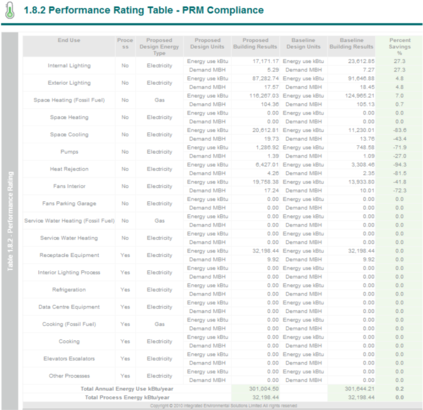
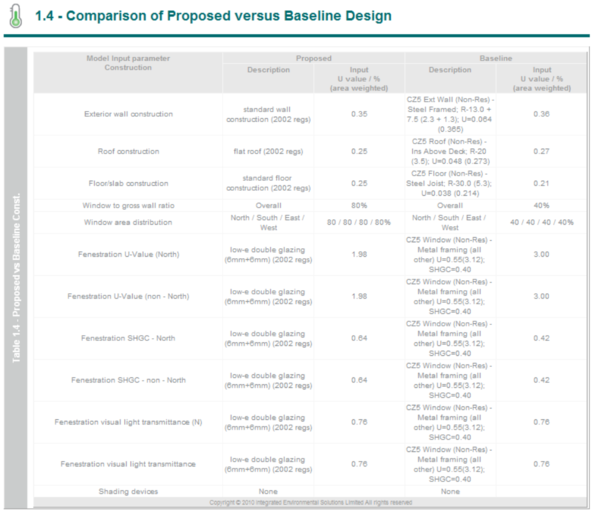
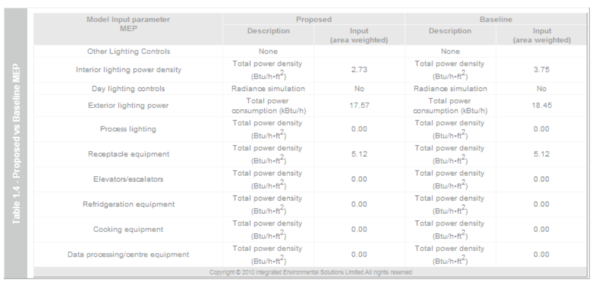
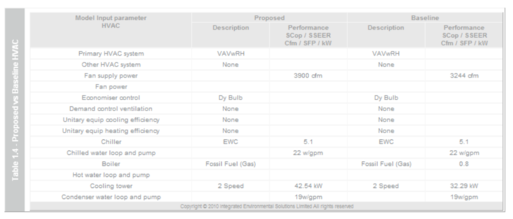
Table 1.4 – Comparison of Proposed versus Baseline Design
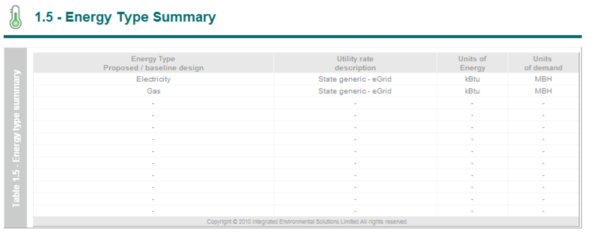
Table 1.5 – Energy Type Summary
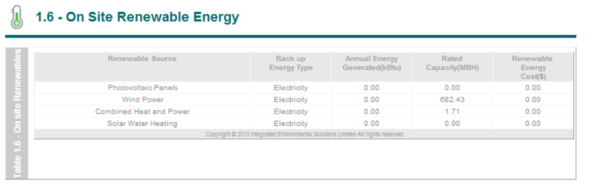
Table 1.6 – On Site Renewable Energy
Table 1.7 - Exceptional Calculation Methods
Detailed Simulation Reports
Proposed
This step enables the generation or display of the 10 minute checklist report for the proposed model. The report contains four separate sections.
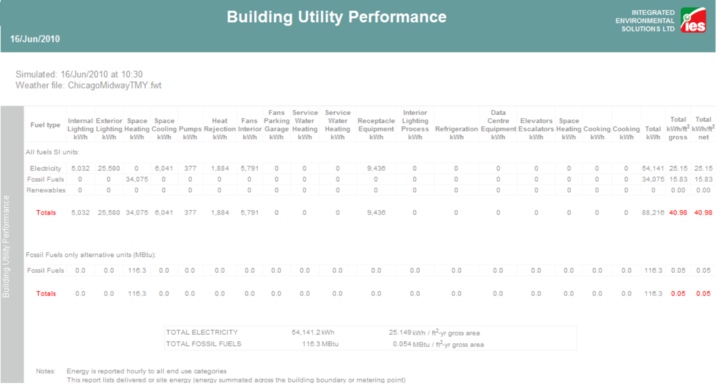
Building Utility Performance Table:
This table details the utility breakdown for each of the end use categories associated with the PRM analysis and includes electricity, fossil fuels and any renewables.
The report also displays the total energy associated with electricity and fossil fuels.
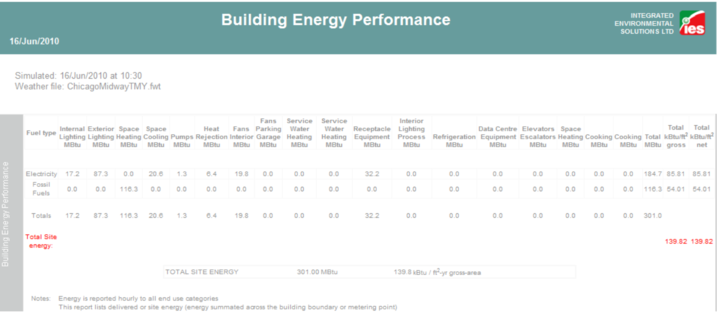
Building Energy Performance Table:
This table details an energy breakdown for each of the end use categories associated with the PRM analysis.
The report also displays the total site energy calculated.
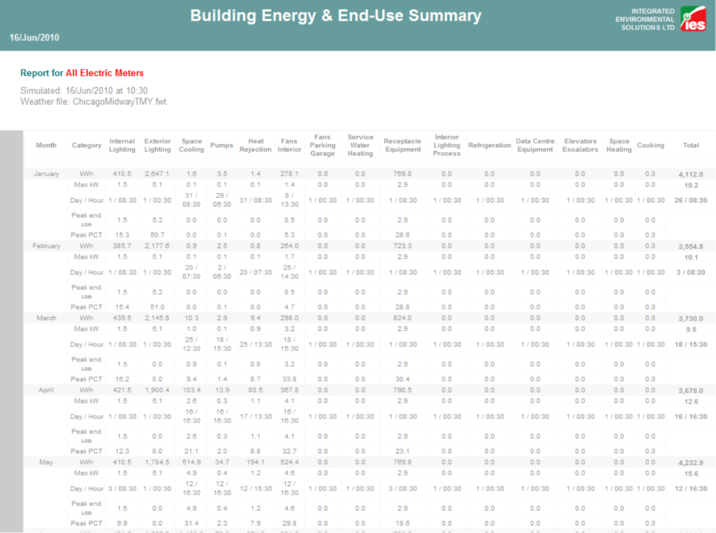
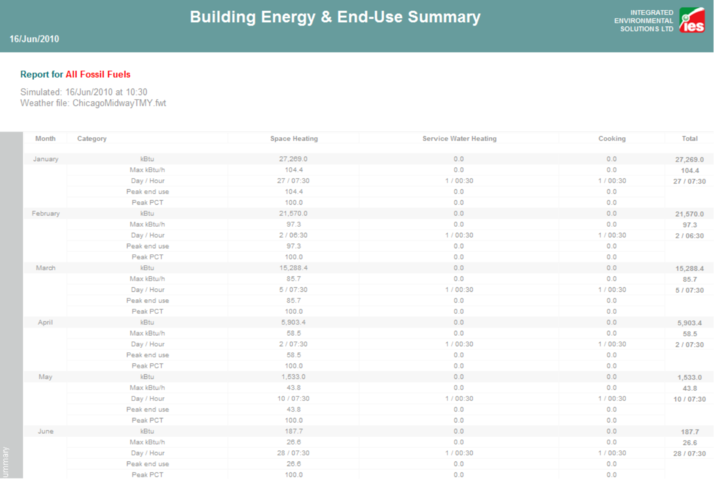
Building Energy & End Use Summary Table - Electricity:
This table shows a detailed breakdown of the monthly performance of each of the PRM end use categories for all electric meters.
The annual electricity energy is also shown for each end use and summed to give the total annual electrical energy.
Note: The total column in this report may not be the sum of end uses; any excess generated electricity (negative total) is assumed to be exported
Building Energy & End Use Summary Table – Fossil Fuel:
This table shows a detailed breakdown of the monthly performance of each of the PRM end use categories for all fossil fuel meters. The annual fossil fuel energy consumption is also shown for each end use and summed to give the total annual fossil fuel energy consumption.
Baseline 0°
This enables generation or display of the Detailed Simulation Report for the baseline 0o model.
Baseline 90°
This enables generation or display of the Detailed Simulation Report for the baseline 90o model.
Baseline 180°
This enables generation or display of the Detailed Simulation Report for the baseline 180o model.
Baseline 270°
This enables generation or display of the Detailed Simulation Report for the baseline 270o model.
ASHRAE 62.1
Display Selected Reports
This action provides for the selection and display BPRM Reports for individual PRM runs (proposed plus four baselines), if multiple simulation runs have been performed. For example, you may have run a number of scenarios to be compared or may have completed a separate run as an Exceptional Calculation Method or with renewable energy systems added, etc. that will be separately reported in the submittal .
Additional Documentation of VE Results for LEED EA credit 1 submittal
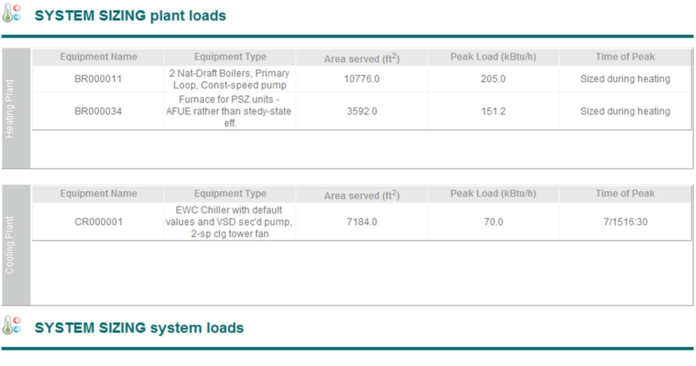
The majority of the data needed for the LEED submittal is included in the BPRM Reports, Detailed Simulation Reports, and ASHRAE 62.1 ventilation report described above. It may be desirable to include additional documentation, such as the System Sizing reports as introduced in the Sizing Runs section of this user guide.
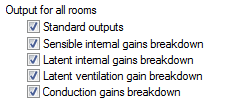
· When you complete the Room Loads Calculation step in either the System Prototypes & Sizing or PRM Navigator, this generates a loads report. It is best to use the report generated at the time of the loads run used for sizing of zone airflows, etc. If the Conduction Gains Breakdown and other internal gains breakdowns are checked in the Output Options dialog within ASHRAE Loads, then that data will be recorded for query in Vista Results and for display in the loads report.
o When running ASHRAE Loads, the recommended Simulation Options for achieving a high level of accuracy in results are as follows:
§ External convection model: McAdams (this model varies the convection coefficients with wind speed and surface-to-air delta-T)
§ Internal convection model: Alamdari & Hammond (this model varies the convection coefficients with surface-to-air delta-T)
o The suggested Output Options for detailed documentation are as follows:
o To have the loads report include detailed results for each zone or separate space in the model (including UFAD plenums, occupied zones, stratified zones, etc.), once in Vista Results and prior to clicking the report generator button on the toolbar, you will need to go to Report Preferences on the Settings menu and select Detailed room loads. This will add a report section for each space.
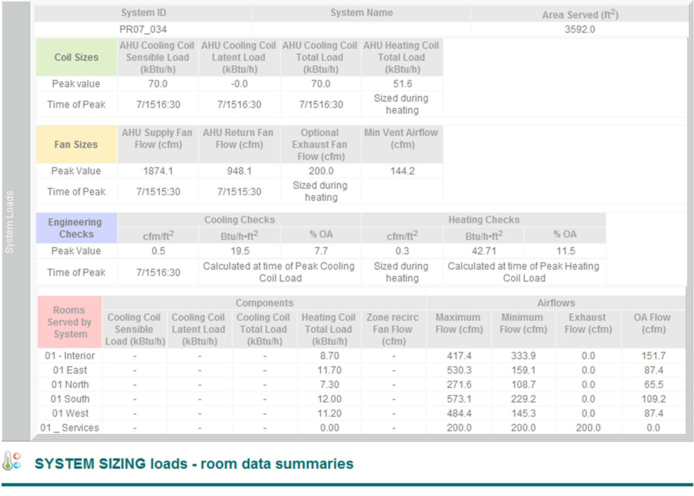
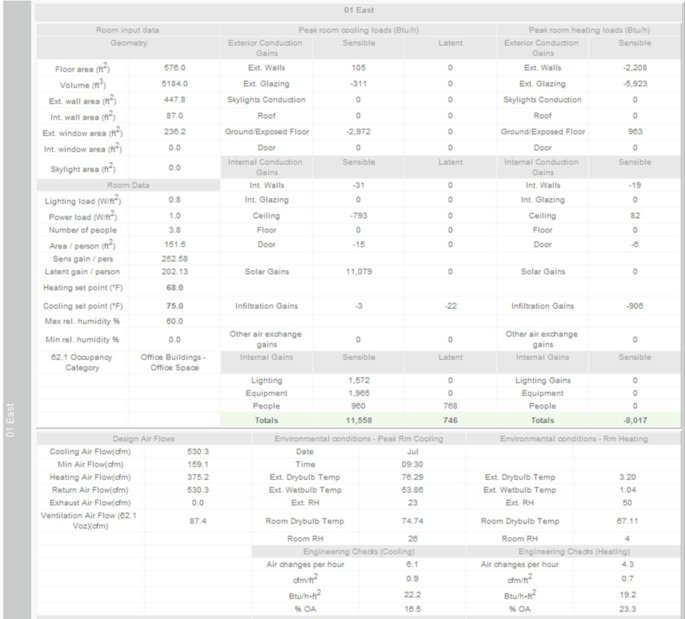
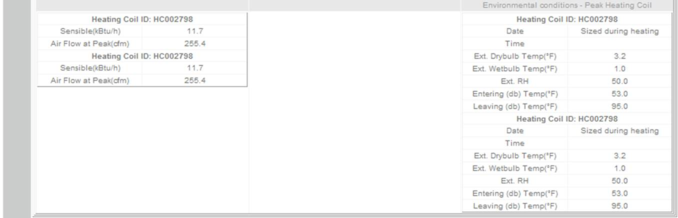
· When you complete the System Load Calculations step in either the System Prototypes & Sizing or PRM Navigator, this will then generate a similar report for each space, this time including much more information about the actual loads and flow rates, etc. for each zone as seen by the actual system at the time of sizing. The following is an example of one system section and one zone section of from this report. Note that presently, this system sizing report can be generated and displayed only via one of the two workflow navigators named above. As of VE 6.4, this will also be generated by a sizing run initiated from within ApacheHVAC and accessed directly from the Vista Results viewer.
Note that for non-standard systems and equipment, certain plant items may not show up in the System Sizing reports above, as they are not dealt with in the same manner as other more standard equipment. For example, if an Indirect-Direct Evaporative Cooling system is used in the proposed design, the cooling section of this actually consists of a couple spray chambers, a heat exchanger, a bypass damper or two, and controllers for the target leaving conditions. As there are many ways to set this up, size the components, and control the cooling effect, this does not lend itself to autosizing per se, nor are there appropriate values to report as would otherwise be the case for a cooling coil or chiller. For example, in the case of capability for a spray chamber to achieve the maximum saturation performance of the selected unit (e.g., 84% effectiveness), the normal configuration would allow the spray chamber to add as much water to the airstream as required to achieve this level of performance. It is then up to the engineer to ensure that the actual selected unit can achieve this at the design cooling conditions, including entering air conditions and flow rates.
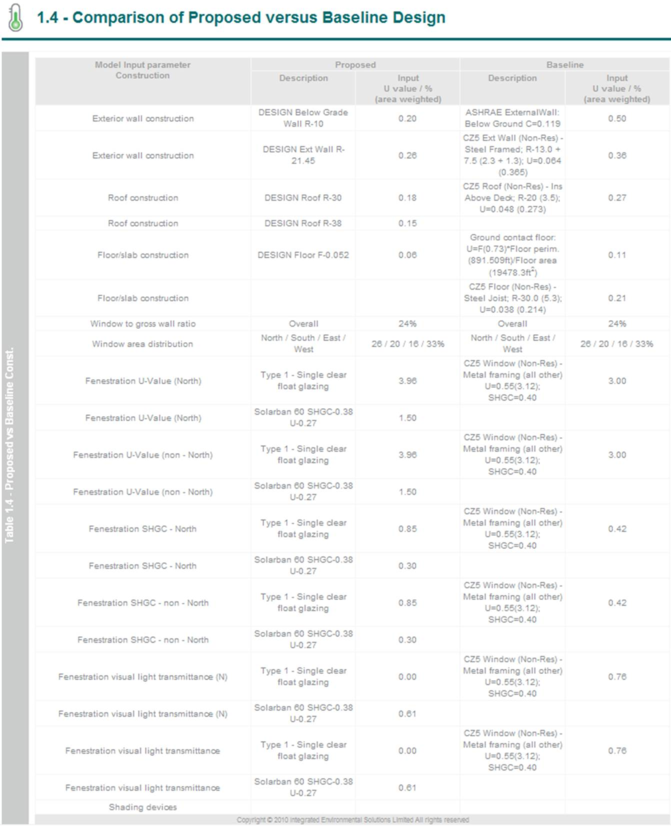
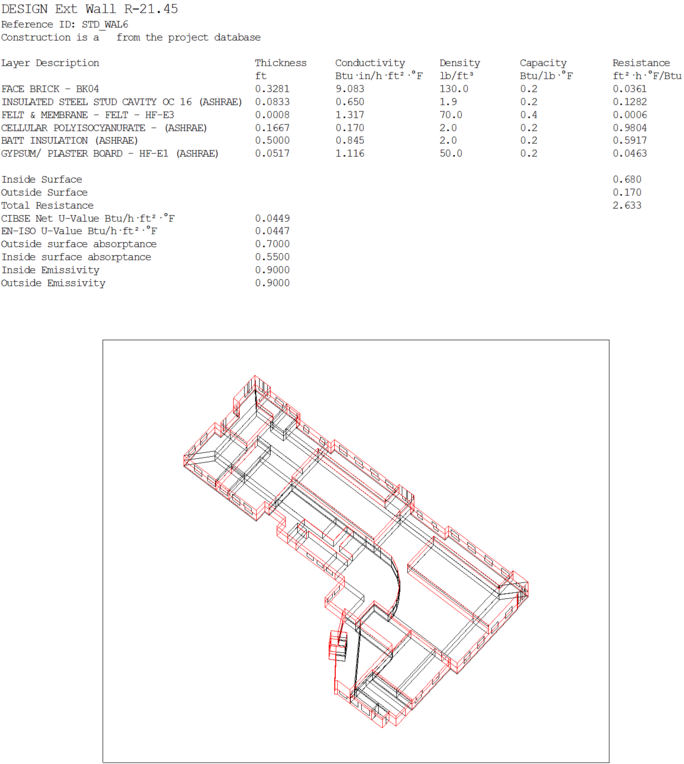
Section 1.4 Proposed vs. Baseline Constructions in the BPRM Reports will provide most of the necessary documentation (as shown above) for these aspects of the modeling. However, some users may wish to provide additional supporting detail regarding constructions.
For example, it might be desirable to make a list of the constructions used in the model, then paste in screen captures, such as that shown below, for each of these constructions (e.g., if you want to include the ASHRAE U-value calculations (which use ASHRAE rather than CIBSE or ISO values for indoor and outdoor temperatures and air-film resistance).
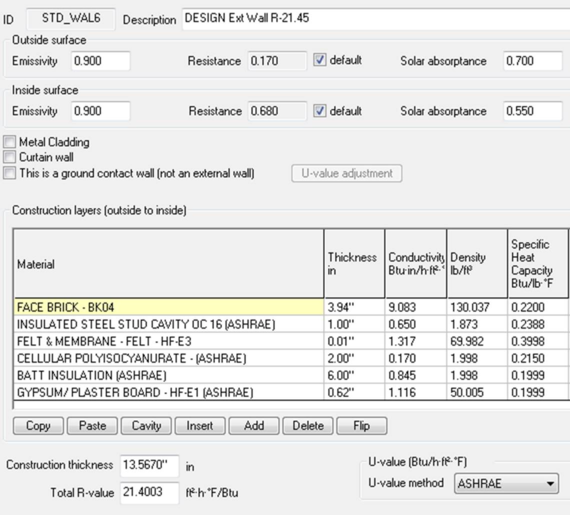
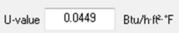
It may then be helpful to copy the image of the building with red highlights from the Construction Assignment dialog (use the Copy button) and paste this in to show where in the model each construction type has been applied. An example of this is included below. The copy of this image also comes with a text version of the contents of the dialog above; however, this includes only the CIBSE and ISO U-values. While these can be forced to match the ASHRAE values by fixing the inside and outside air-film resistances at the ASHRAE values in the construction, doing so will negate the effect of variable convective heat transfer coefficients if they are selected for the simulation (in the ApacheSim dialog).