Generic Tariff analysis overview
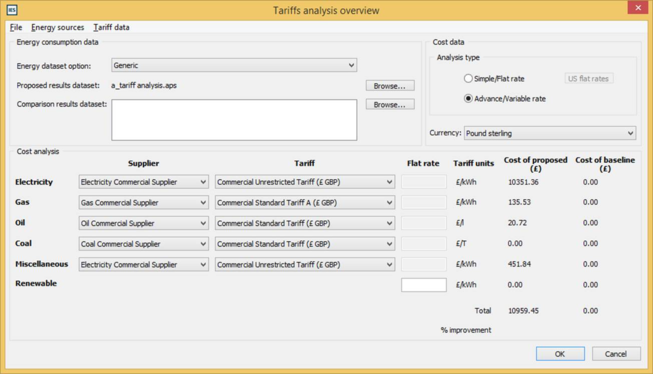
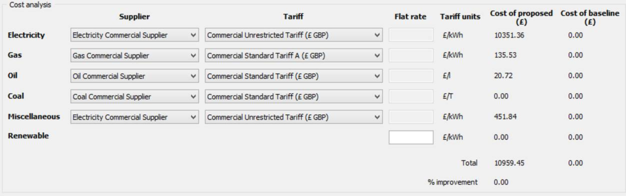
Image 1 shows the tariffs analysis main window. From this window users can select the tariffs, import the APS file from VistaPro and get the analysis results, including the final cost for each utility for the tariff being used.
Image 1. Tariffs analysis main window
Menus
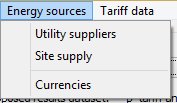
Three menus are available: ‘File’, ‘Energy sources’ and ‘Tariff data’.
File menu
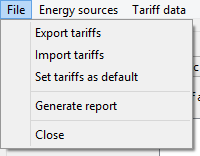
File related options can be found here, being:
- Export tariffs: currencies, suppliers, taxes and discounts, USA flat rates and utilities tariffs will be exported in a single file, by default, to folder C:\Users\username\AppData\Local\IES\Tariffs
- Import tariffs: a valid exported tariffs file can be imported replacing all the existing data. Old engine files can be imported too.
- Set tariffs as default: current data, such as tariffs, suppliers… can be set as default for new projects.
- Generate report: if Microsoft Word is installed in the system, a report can be generated through the menu and saved in the project Vista folder. It contains a summary, for every utility, of the energy demand and cost, both for the proposed and baseline profiles.
- Close: closes the tariffs analysis window.
Energy sources menu
Utility suppliers
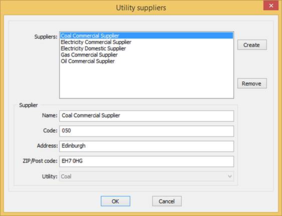
This window allows the user to manage the suppliers for any utility and at least one supplier is needed in order to create tariffs.
‘Name’, ‘Code’ (specific number of each supplier), ‘Address’ and ‘ZIP/Post code’ are editable cells and their information will appear in the report. A supplier containing ‘United States’ or ‘U.S.A’ in the address is considered to be located in the United States of America.
Image 2. Utility suppliers’ window
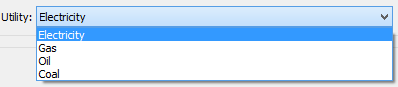
‘Utility’ can only be selected when creating the supplier and then it will be disabled. It is shown in a drop-down list with four options:
It will act as a filter when creating the tariffs. Suppliers are specific for only one utility type, therefore, for example, only the suppliers specified as ‘electricity’ can be selected when creating a new electricity tariff.
Site supply
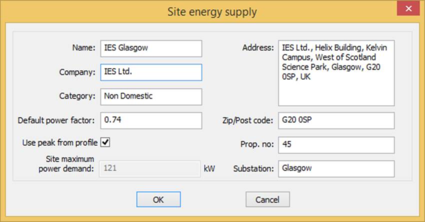
When clicked, the site energy supply window will pop up.
Image 3. Site energy supply window
All these fields are only for display purposes with the exception of ‘Default power factor’ and ‘Site maximum power demand’, used for computing.
‘Default power factor’ is the real power ratio to the apparent power. The values range is between 0 and 1 and the default value is 0.85. The real power is the circuit capacity for performing work at a certain time (kW). The apparent power is the product of the current one and the circuit voltage and is measured in kilo volt-amperes (kVA).
kW = kVA * PF
‘Site maximum power demand’ is used when the profile is not accurate enough to include the real peaks of demand for the site. This value will be used as a constant value of peak demand for the electricity tariffs that are based on the peak of maximum demand such as ‘Maximum Demand’ and ‘Availability Charge’. Every period of time shall use the same maximum demand.
‘Use peak from profile’ allows analysis to be performed using directly the values from the aps file.
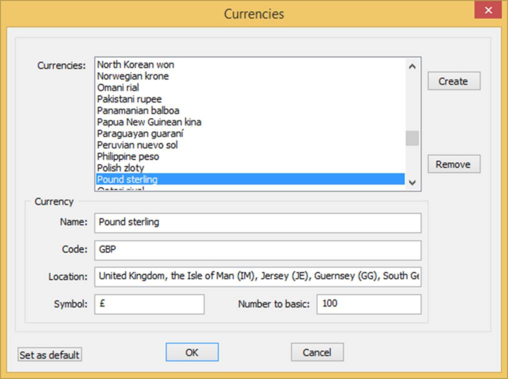
Currencies
About 170 currencies around the world are included by default. However, it’s possible to create new ones.
Image 4. Currencies window
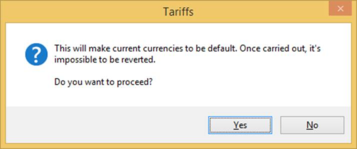
The ‘Set as default’ button will establish current currencies to be default for new projects.
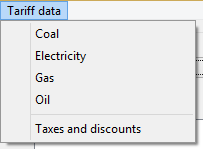
Tariff data
Utilities tariffs and taxes/discounts can be managed from this menu.
Coal
Coal tariffs management can be achieved through four pages.
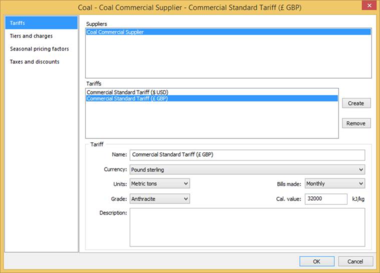
Tariffs
Image 5. Tariffs page
Suppliers and their tariffs are shown in the coal tariffs page. New tariffs can be created for the selected supplier and modified when necessary. For those suppliers located in the United States, short tons will be suggested for the units. However, any can be selected at a later time.
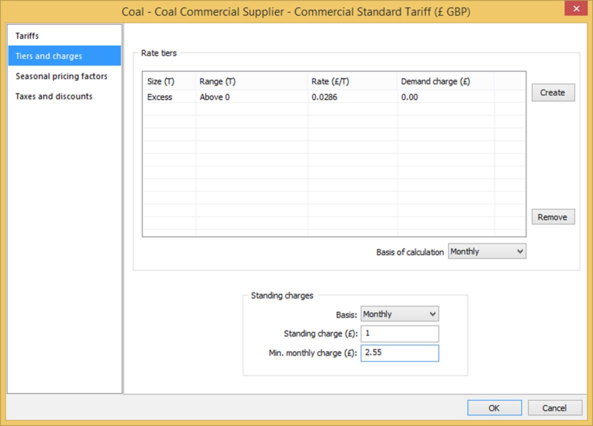
Tiers and charges
This page will display the tiers and demand charges the selected tariff has. Any number of blocks can be created with its rate and demand charge. The range covered by each is shown in column Range.
Image 6. Tiers and charges page
Seasonal pricing factors
Every month’s energy demand cost will be multiplied by its seasonal pricing factor.
Image 7. Seasonal pricing factors page
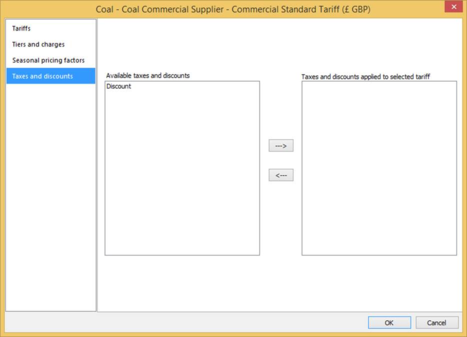
Taxes and discounts
Applicable taxes and discounts to coal tariffs will be listed on the left. Those applied to the selected tariff will on the right.
Image 8. Taxes and discounts page
Electricity
Electricity tariffs management can be achieved through four pages and the annual planner.
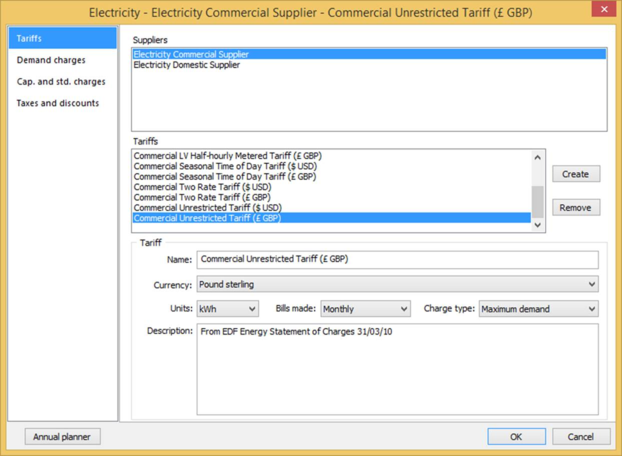
Tariffs
Suppliers and their tariffs are shown in the electricity tariffs page. New tariffs can be created for the selected supplier and modified when necessary.
The charge type defines how the cost is computed, with three possible options:
- Basic : only standing charges, defined in the charges page, and unit charges (‘Annual planner’ button) are taken into account for computing.
- Seasonal time of day : by selecting this option, the charges page will be enabled. Capacity charge is used to compute and added to the basic computing.
- Maximum demand : under this option, regimes and charges pages will be enabled. Demand charges defined in the charges page are added to the seasonal time of day computing.
Image 9. Tariffs page
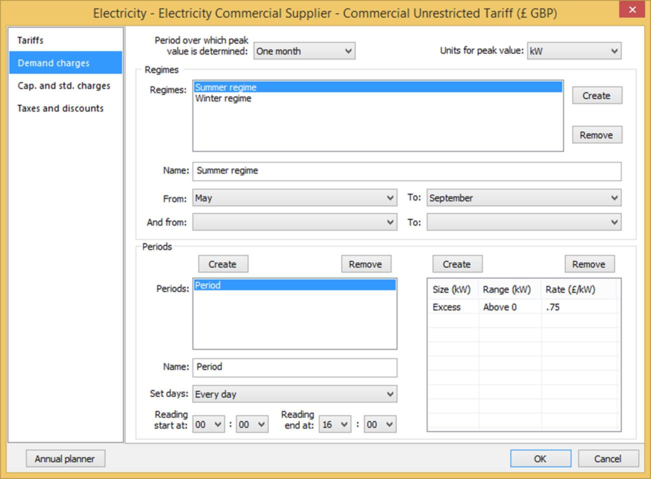
Demand charges
Regimes and periods can be managed through this page, available only for tariffs whose type is maximum demand.
Image 10. Regimes page
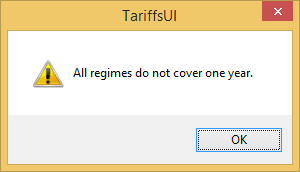
A regime accepts a name and the months it will be applied to as long as the whole year is covered. Otherwise, a message will pop up.
A period can hold any number of tiers, each with the rate to apply for every regime.
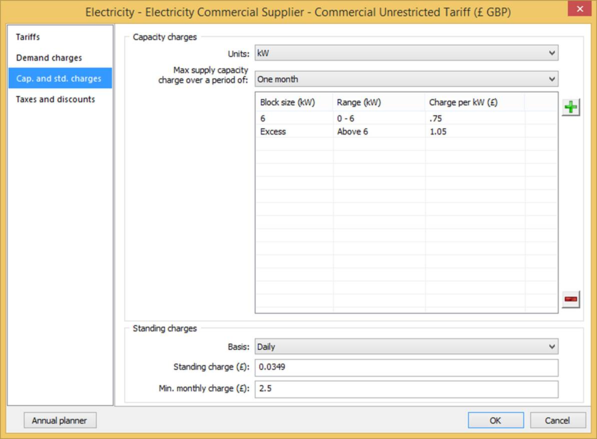
Capacity and standing charges
Both standing and capacity charges, with any number of tiers, can be created in this page, available only for tariffs whose type is seasonal time of day or maximum demand.
Standing charges calculation
For monthly basis, the standing charges are the standing charge. For daily basis, the standing charges are the standing charge multiplied by the number of days of the month to compute.
Capacity charges calculation
If kVA selected, the Power Factor is used to convert to kW (kW = kVA * PF). For every month, the maximum demand value will be used to compute unless the ‘Use peak from profile’ checkbox in the site window is not ticked in which case the ‘Site maximum power demand’ value will be used. In either case, those units are computed with the blocks.
Image 11. Charges page
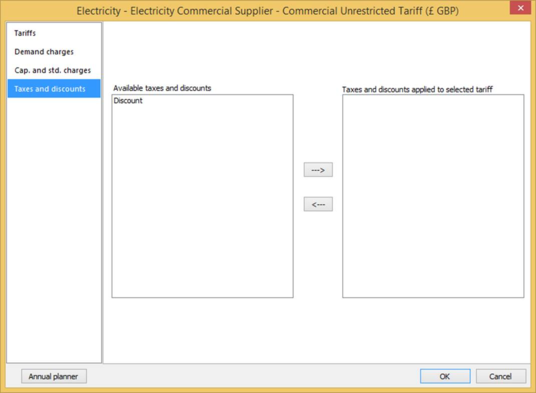
Taxes and discounts
Applicable taxes and discounts to electricity tariffs will be listed on the left. Those applied to the selected tariff will on the right.
Image 12. Taxes and discounts
Annual planner
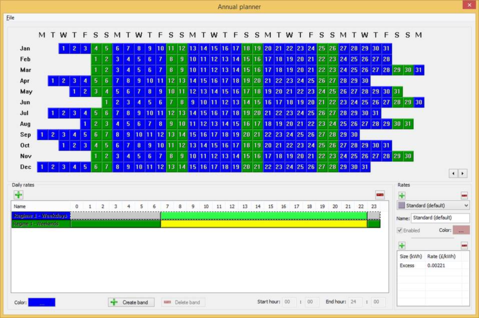
The annual planner can be accessed through the button with the same name in the electricity main window and allows to configure the way the energy demand cost will be computed.
Image 13. Annual planner window
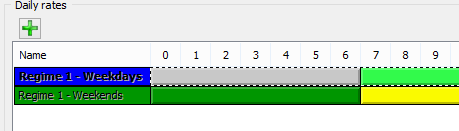
Available daily rates will be shown in the bottom half window and can be created and deleted just by clicking the appropriate button. At any time, a daily rate name can be changed by double clicking on it and its colour with the ellipsis button.
Image 14. Daily rates
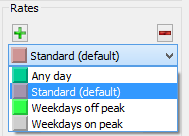
The rates the selected daily rate has are displayed in a drop down list on the bottom right area as shown in image 15. They can be modified or deleted except the standard one.
Image 15. Rates
Timing rates assignment is shown in the daily rate row, covering the whole day, from 00:00 to 24:00 hours.
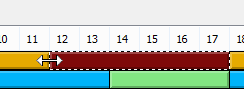
In order to create a band, select the desired rate and click on the ‘Create band’ button. Hover over the daily rate row and click again for the starting point. Another click will complete the band creation. Any band, except the standard one, can be stretched or moved very easily with the mouse. Both time limits can be modified also by typing the hour or minutes in the fields below the rows. When computing, the lower limit is included in the time interval but the upper one is not.
Image 16. Band being stretched
The selected band can be deleted just by clicking the ‘Delete band’ button or by pressing the delete key.
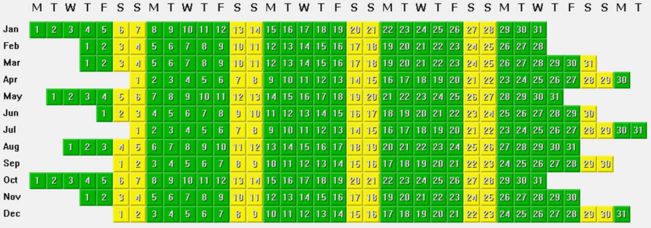
The year stored in the APS file is shown in the calendar with the daily rates assignment for each day.
Image 17. Calendar
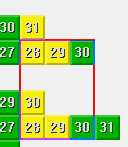 One click on a single day with the left mouse button will assign the selected daily rate to that day. Columns and whole months can be assigned by clicking on the corresponding header letter or month label. Clicking and dragging with the mouse will assign several dates. Performing those actions with the right mouse button will leave the targeted days with no daily rate assigned.
  There are two arrows for easy navigation through the calendars. Any electricity tariff should have the daily rates assigned in all of them.
 ‘File’ menu can be used for saving the modifications carried out.
Gas
Gas tariffs management can be achieved through four pages.
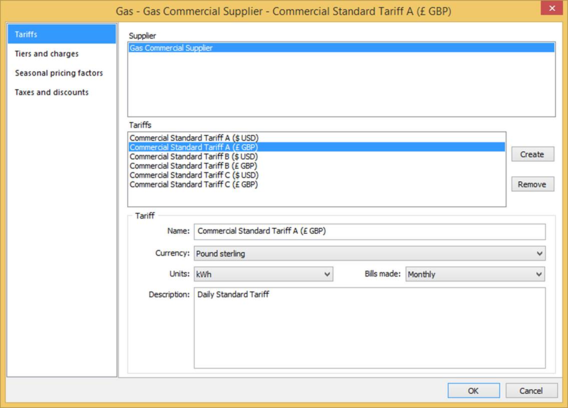
Tariffs
Image 18. Tariffs page
Suppliers and their tariffs are shown in the gas tariffs page. New tariffs can be created for the selected supplier and modified when necessary. For those suppliers located in the United States, therms will be suggested for the units. However, any can be selected at a later time.
Tiers and charges
This page will display the tiers and demand charges the selected tariff has. Any number of blocks can be created with its rate and demand charge. The range covered by each is shown in column Range.
Image 19. Tiers and charges page
Seasonal pricing factors
Every month’s energy demand cost will be multiplied by its seasonal pricing factor.
Image 20. Seasonal pricing factors page
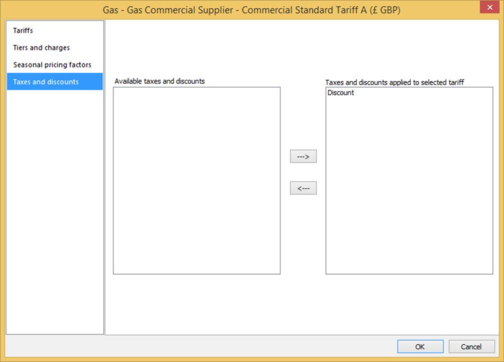
Taxes and discounts
Applicable taxes and discounts to gas tariffs will be listed on the left. Those applied to the selected tariff will on the right.
Image 21. Taxes and discounts page
Oil
Oil tariffs management can be achieved through four pages.
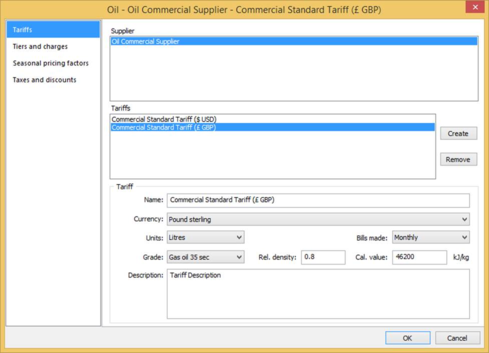
Tariffs
Suppliers and their tariffs are shown in the oil tariffs page. New tariffs can be created for the selected supplier and modified when necessary. For those suppliers located in the United States, US gallons will be suggested for the units. However, any can be selected at a later time.
Image 22. Tariffs page
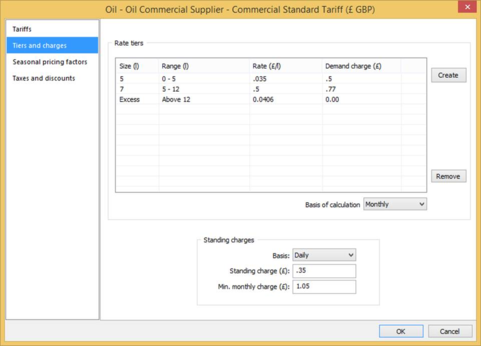
Tiers and charges
This page will display the tiers and demand charges the selected tariff has. Any number of blocks can be created with its rate and demand charge. The range covered by each is shown in column Range.
Image 23. Tiers and charges page
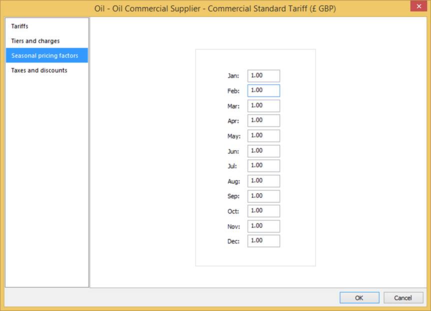
Seasonal pricing factors
Every month’s energy demand cost will be multiplied by its seasonal pricing factor.
Image 24. Seasonal pricing factors page
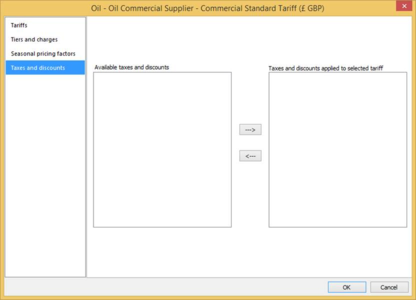
Taxes and discounts
Applicable taxes and discounts to oil tariffs will be listed on the left. Those applied to the selected tariff will on the right.
Image 25. Taxes and discounts page
Taxes and discounts
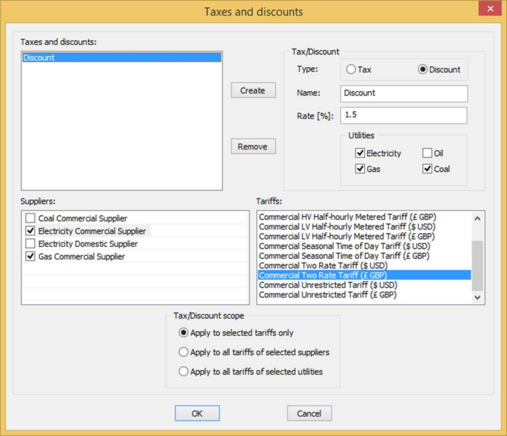
Taxes and discounts are used in the last computing stage and can be managed through this window.
In order to create a tax or discount, click on the ‘Create’ button, select the type, a name, the rate and the utilities it will be applied to. There are three scopes available:
- Tariffs: the tax or discount will be applied only to the selected tariffs, displayed highlighted. Users can press Shift or Ctrl keys for multi selection.
- Suppliers: the tax or discount will be applied only to the selected suppliers.
- Utilities: the tax or discount will be applied only to the ticked utilities.
Image 26. Taxes and discounts window
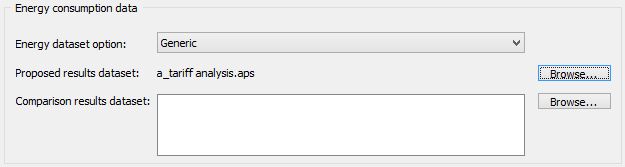
Energy consumption data
This area defines where the energy will be read from, with three options:
- ‘Energy dataset option’ has the building regulation to use being one of these:
- ASHRAE 90.1: with a proposed aps file beginning by p_, up to four files will automatically be used in the baseline for analysis, being b[000]_..., b[090]_..., b[180]_... and b[270]_...
- Generic: up to one file can manually be added to the baseline through the ‘Browse…’ button.
- UK Part L2: with an actual aps file beginning by a_, notional (n_...) and reference (r_...) files will be looked for.
- ‘Proposed results dataset’ allows the user to browse and pick the aps file to analyse. The ‘Browse…’ button opens by default the vista folder of the project in use.
- ‘Comparison results dataset’ allows the user to compare two aps files with the same tariffs. The ‘Browse…’ button opens the same vista folder of the project in use.
If the tariff analysis is open from VE compliance, the default APS file would be the one analysed in the simulation.
Image 27. Energy consumption data
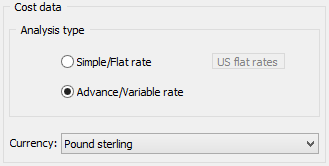
Cost data
Image 28. Cost data
Analysis type
There are two main possibilities of tariff analysis types: simple and advanced.
Simple / Flat rate
This option limits the user to input tariff’s information only for flat rates setting the units to the following, depending on the currency:
- Electricity: kWh
- Gas:
o For US currencies: therms (thm)
o For rest of the world: kWh
- Oil:
o For US currencies: gallons (gal)
o For rest of the world: litres (l)
- Coal:
o For US currencies: Short tons (ST)
o For rest of the world: Metric tons (MT)
- Miscellaneous: kWh
- Renewables: kWh
If selected with the United States dollar currency, ‘US flat rates’ button will be enabled.
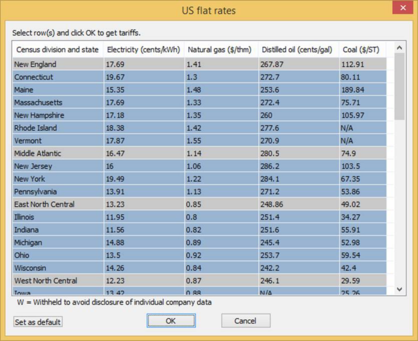
US flat rates.
This window has the rates for all of the utilities by state (light blue rows) and census division (light grey). Rates belonging to a state can be updated and the new average rate will be shown in the census division that state belongs to.
Image 29. US flat rates
Clicking the ‘OK’ button will accept the changes and copy the average rates of the selected rows, if any, to the main window. Clicking ‘Cancel’ will discard any modification.
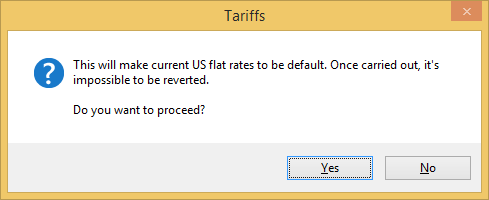
The ‘Set as default’ button will make current rates to be default for future projects.
Image 30. US flat rates default question
Advance / Variable rate
This will provide full access to the Tariff Analysis. The user can create tariffs and combine them to create a realistic scenario of the total cost of running the building. This option also allows the user to incorporate flat rates in combination with the tariffs created. Renewables can only be sold using a flat rate.
Currency
Currency used for costs results working as a filter for the tariffs that were created with that currency. Only the tariffs using the selected one will be displayed in the ‘Cost analysis’ tariff column.
Cost analysis
Image 31. Cost analysis
Utilities
Currently, six types of utilities can be analysed:
- Electricity
- Gas
- Oil
- Coal
Each option allows performing the analysis to only one tariff per utility at a time.
The correlation between the generator fuel for the space conditioning (heating or cooling systems), lights, cooking utilities, machinery, miscellaneous and other loads in <VE> with the tariff analysis utilities:
|
Fuel in <VE>
|
Tariff analysis
|
|
Natural gas
|
Gas
|
|
LPG
|
Gas
|
|
Biogas
|
Gas
|
|
Oil
|
Oil
|
|
Coal
|
Coal
|
|
Anthracite
|
Coal
|
|
Smokeless fuel (inc. coke)
|
Coal
|
|
Dual fuel (mineral + wood)
|
Coal (solid fuel)
|
|
Biomass (not renewable)
|
Coal (solid fuel) Need modification
|
|
Biomass (renewable)
|
Need modification
|
|
Electricity
|
Electricity
|
|
Waste heat
|
Need modification
|
|
Misc. A, B, C, D, E, F, G, H, I, J, K, L, M, N, O, P, Q, R, S, T, U, V, W, X, Y & Z
|
Miscellaneous
|
|
Renewables
|
Already embedded in simulation
|
Renewables
The excess of electricity generation that is not consumed on-site, calculated for each hour where the electricity generated is higher than the electricity consumed, can be sold to the grid at a price stated by the renewable flat rate. It takes into account all the renewable energy technologies that generate electricity: Photovoltaic panels, wind generators, solar water heating and combined heat and power.
On-site electricity generation
The renewable options included in VE for electricity generation are: Photovoltaic panels, wind generators, solar water heating and combined heat and power, in VistaPro, summarized in ‘Total grid displaced electricity’.
These options allow the user to get real savings on electricity generation on an hourly basis. This also allows the system to determine the hours when the electricity generated is greater than the electricity consumed by the building, therefore that excess can be sold to the grid at a flat rate.
Supplier
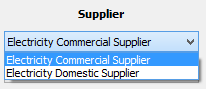
For each utility, the suppliers assigned to it will be shown in a drop down list. The selected supplier will be used to compute.
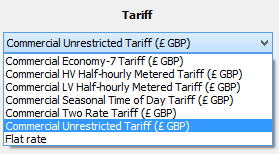
Tariff
This column shows drop down lists containing the tariffs created and assigned to the selected supplier having the chosen currency. A flat rate option is always available for any utility and supplier.
Flat rate

When ‘Simple/Flat rate’ is ticked, flat rates fields are enabled. Any rate shown here will be used to compute. For renewable energies is always available.
Tariff units
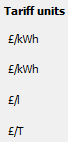
The units costs are expressed in will be labelled here.
Cost of proposed
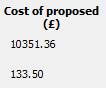
‘Cost of proposed’ shows the total cost and individual cost for each utility of running the proposed building based on the tariffs selected.
Cost of baseline
If a profile has been included as a comparison profile, it will show the total and individual costs for each utility based on the tariffs selected. In this case, the ‘% improvement’ will display the percentage of improvement between the benchmark and the proposed designs.