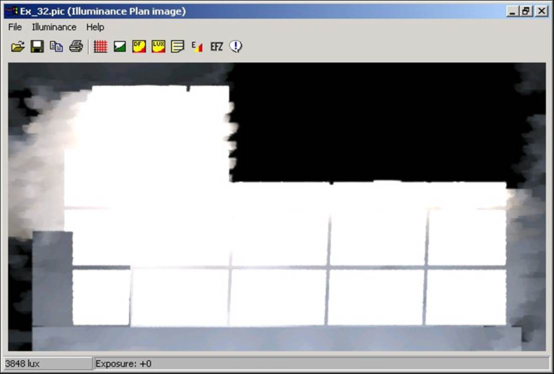
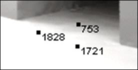
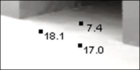
For an illuminance image the pop-up window is:
When we load an illuminance image, we are presented with the Illuminance Toolbar and also the Illuminance Menu.
The exposure can be adjusted from -5 to +5 (as for luminance image) and is displayed in the second pane of the status bar at the bottom of the window.
The first pane of the status bar shows the Lux level (or DF) at the cursor position.
Illuminance Toolbar

Open

Save

Copy

Print

Grid Settings

Threshold Settings

Daylight Factors

Lux Contours

Picture Summary

Adjust Exposure

Tooltip Settings
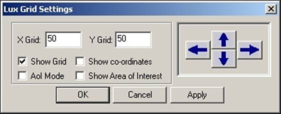
Grid Settings
Using this dialogue, we can specify the size of grid that we wish to view the Lux values in. Once the button labelled “Show Grid” is checked we will see the Lux levels at the specified intervals. We can scroll the image using the arrows provided. As we scroll the Lux values will be updated to reflect their respective values at the new position.
Using this dialog, we can show or hide the area of interest (AoI). The area of interest enables the user to analyse a specific section of the image and thus, omit the part of the image that they are not interested in.
See Area of Interest
Illuminance Menu
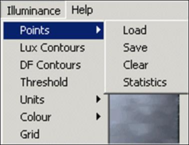
Points > Load
Points > Save
Points > Clear
Points > Statistics
Lux Contours
DF Contours
Threshold
Units
Colour
Grid Settings
Load
We can load in a pre-defined points file that contains all the points in the image that we wish to obtain spot Lux values for.
Save
Save the currently defined points in the image which we can then read in at a later date.
Clear
Clear the current points.
Statistics
Displays a pop-up window showing various statistics such as total average Lux, % threshold and the spot Lux value for each defined point, etc.
Lux Contours
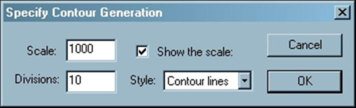
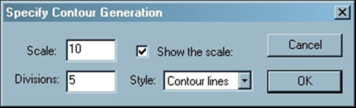
This option allows the user to generate a Lux contour image for the current illuminance image. A simple pop-up window is displayed, which the user uses to enter parameters for the Lux contour image. Once the user has selected these, it is possible to create the image.
Pops-up the following window:
The “Contour Style” can be “Contour lines”, “Contour bands” or “False colour”. The “Show the scale” tick-box can be used to switch the scale on or off (where the same scale is used for a series of images it can often be useful to cut the scale out and display separately). The default values for “Scale” and “Divisions” can be set to any user defined values. This generates a new image.
DF Contours
This is the same as for Lux contours.
Pops-up the following window:
This works in the same way as the “Lux Contours” option.
Threshold
This option is only available for:
· Illuminance – working plane images.
· Illuminance plan view images.
· Right To Light images.
It enables the user to display the area of the image that falls below or above a defined Lux level. If desired, the user can display the area of the image that falls below a defined percentage threshold.
The user also has the option here of outputting the displayed Lux polyline to a DXF file, which can then be read into other cad systems.
Units
This option allows us to define which units we wish to display the results in, Lux or Daylight Factors.
Colour
We can change the font colour for the spot values on the image by selecting from the sub-menu.
Grid
This option enables the user to set the x-y grid size for displaying the spot values.
When the cursor is moved across an illuminance image the Lux value is displayed in the first pane of the status bar at the bottom of the window. If the left mouse button is clicked at any point the Lux value [or DF value] is displayed and the position stored in a list of points.
A right mouse click will delete the nearest point from the screen and from the list of points. The “Load” option read the list of points from a file. The “Save” option will store the current list to a file. “Clear” will remove all the points and empty the list of points.