Daily, weekly and annual profiles represent time series which follow patterns related to weeks or months (with exceptions for holidays). If the aim is to replicate a measured time series, it would be necessary to create 365 (or 366) daily profiles embedded in 52 weekly profiles comprising an annual profile. Every data point would then have to be entered manually.
Instead, the user can make use of the Free-form Profile facility, which allows them to import time series data, via .ffd files, from products such as IES-SCAN and to use that data to drive a profile. Alternatively, the user can manually enter data covering a period of up to an entire year without having to specify daily, weekly and annual profiles.
Editing a Free-form Profile
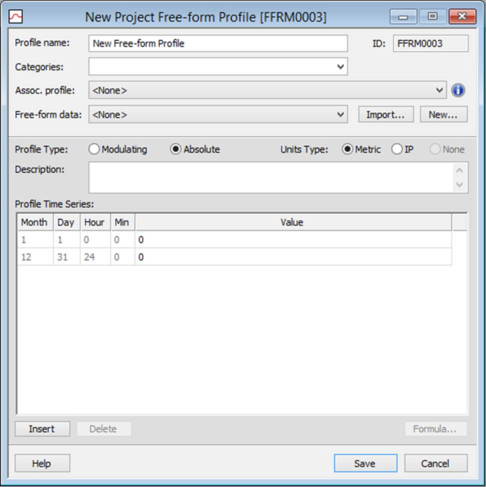
Clicking “New” or selecting an existing free-form profile and clicking “Edit” opens the dialog shown below.
The user can supply a name by which the profile will be known in the various profile selection controls throughout the software by editing the “Profile name” text box. They can also specify, as with other profiles, categories into which the profile falls by using the “Categories” control. This allows filters to be used in the profile selection controls.
An “Associated profile” may optionally be specified. This is a standard weekly or annual profile which will be used in place of the free-form profile for loads simulations.
Free-form profile data is stored in .ffd files. The file in which the data is stored is specified via the “Free-form data” control. The drop down menu displays all .ffd files detected by the VE; selecting one of these loads the data from the .ffd file and displays it in the “Profile Time Series” table below, where it may be edited.
One can import a .ffd file from another directory into the project and set it as the active file by clicking “Import” and selecting a valid .ffd file. Alternatively, one can create a new .ffd file by clicking “New” or selecting <None> from the dropdown menu. This deselects the selected .ffd file and depopulates the list of data points below. Furthermore, if “Save” is clicked while the free-form data is set to <None>, the user will be prompted for a .ffd filename to which the data will be saved, creating a new .ffd file if necessary.
As with other profiles, free-form profiles may be set as modulating or absolute. The unit type of the profile values can also be set to metric or imperial. The user can also specify a description of the profile, perhaps including details of the measurements used to collect the data.
Finally, the editing dialog provides a table of values that serves as a way to inspect the data, or to change values or dates/times of those values.
Profile Time Series
Values in the Profile Time Series table are specified by month, day, hour and minute. Each value is taken to be expressed in the same units as those specified in the Unit Type selection above.
Users may add or remove any data point from the table, except for the data points at 00:00 on 1st January and 24:00 on 31st December; these points must exist, but the user may opt to change their values.
The Insert button adds a copy of the currently selected point immediately after it in the list, extending the list by one. The user may then edit the new point. If the user changes the date or time of any point, that point is moved to ensure that the list remains sorted in chronologically ascending order.
Note that there may exist multiple points for the same time. This is perfectly valid. However, in this situation, only the first and last of these points as they appear in the table will actually have a contribution to the evaluation of the profile. The first point determines the past interpolation and the last point determines the future interpolation. Consider a free-form profile with the following points defined.
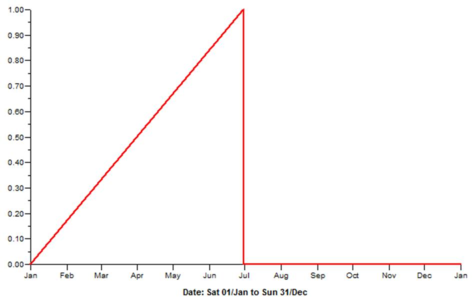
The profile will interpolate between 0 and 1 for all time-steps between 00:00 on 1st January and 24:00 on 30th June. It will then interpolate between 0 and 0 for all time-steps between 24:00 on 30th June and 24:00 on 31st December. Adding a point between these two will have no effect on the evaluation.
The user may only specify real dates and times. 31st September, for instance, is not a real date and the user will be prompted to enter a day value in the range 1 to 30 if they attempt to use such a value. Note that 29th February is only sometimes a real date – i.e. on leap years. For the purpose of free-form profiles, 29th February is considered a real date, but data specified for that date is only used by Apache when the “Treat simulation as leap year” checkbox is checked in ApLocate (see the ApLocate documentation for more details). If this is not checked and a simulation using such a free-form profile is carried out, Apache simply discards those data points and interpolates between the adjacent data points instead.
It should be noted that values need not be only numerical – they can be formulaic too. One may enter a formula into the value field of a data point either directly or via the formula dialog, by using the “Formula” button. The rules for formulas in free-form profiles are the same as those for formulas in schedules, and are set out in more detail in section 12 .
Finally, one can visualize the formula profile by selecting it in the list of profiles and clicking the graph icon:

. The visualization of the profile above is as follows.