Dynamic results files can be viewed and post process in the Dynamic results tab.
Select a room with valid resuts and appropriate result files list become available. If certain room has multiple result files the type of results listed can be made visible or unvisible by ticking on/off the result types option at the bottom of the list.
Information window displays the ID of the room that is currently selected, date of the simulation, map file used, information about the room location and number of the results grid points calculated for the room.
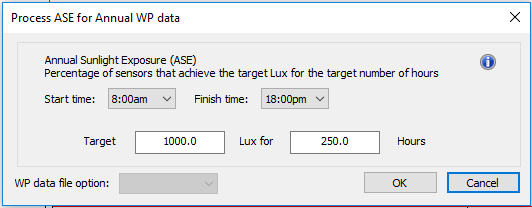
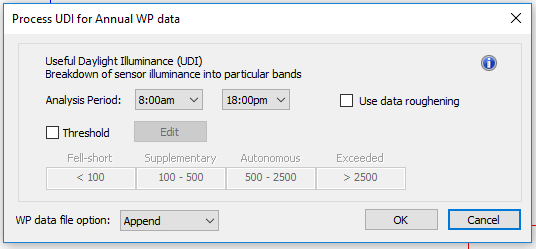
“Process” button opens a window that enables setting up times and thresholds for selected results type.
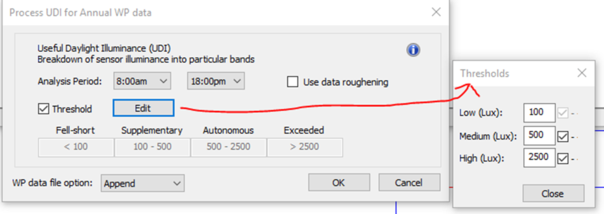
For the UDI the threshold ranges can be edited (e.g. in some UDI studies the ranges are specified as “less than 100”, “100 to 2000” and “greater than 2000”). The “threshold” can be edited by enabling the “Threshold” check-box and clicking the “Edit” button – this pops-up the following dialog:
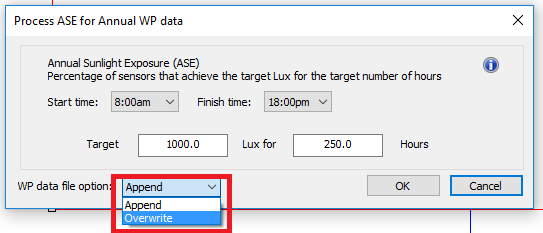
If there is already an existing WP data file the option to append or overwrite results
When the results are processed they can be viewed in the WP Grid tab.
WP Grid
When a zone is selected all the data files that apply to this zone are displayed within the WP Grid tab. The tab includes four sections:
· Files
· Results
· Statistics
· Thresholds
Files
The Files section shows all the results files available. The data files are named using the "ZoneID" eight character label - if the data file has been created using the annual data then "_A" is appended to this label. The files can be selected at the Model level of decomposition. When a results file is selected all the available simulations are displayed in the "Results" section.
Results and Statistics
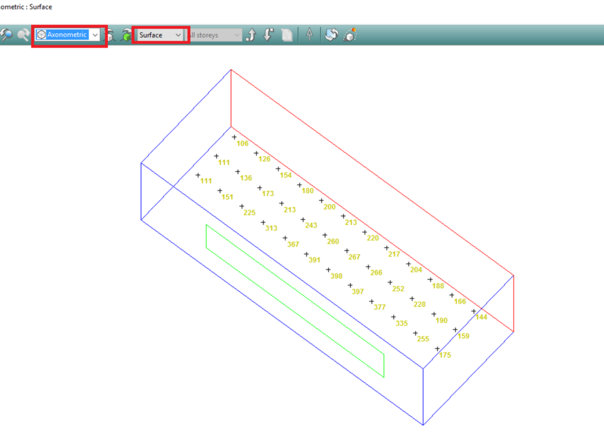
When a simulation from the Results section is selected the results are displayed automatically at the Model level. The results values will be visible at the surface level of decomposition (down a level from a Model level).
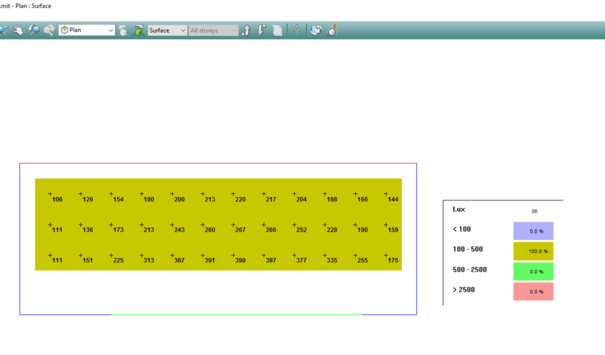
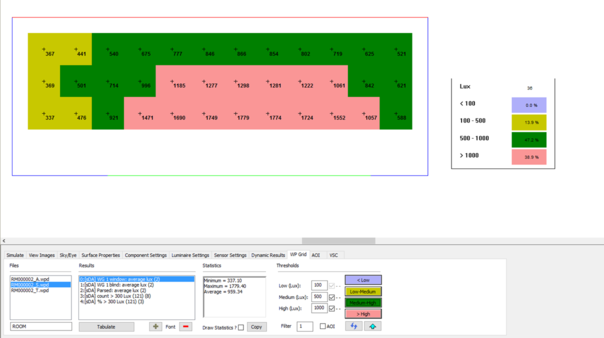
Going to a plan view displays the results in the defined colour bands.
Thresholds
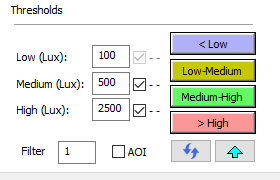
The Thresholds section button displays the thresholds currently active.
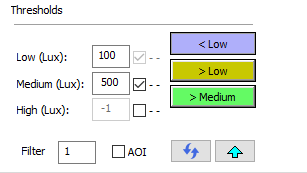
These thresholds can be changed in value or switched off to either three or two ranges, independently of the other ranges.
Filter changes the number of grid points displayed.
The colour can be changed by clicking at the coloured buttons.
When the thresholds are edited the results displayed at the model can be refreshed using the “Refresh display” button

or reset using the ”Reset tresholds and colours” button

.
The “+” and “-” buttons change the size of the font that is used to display the data on the ViewPort. The “AOI” button will clip any cells that overlap the AOI, this can “improve” the display where you have non-orthogonal zones.
The “Filter” check-box value, default to 1, will skip the display of cells data values on the ViewPort, i.e. a value of 1 will show every value, 2 every second value, and 0 will disable the values (this can be useful where the grid is very dense, but also tricky to get a sensible pattern).
In this example the colour of the medium range has been changed and the high threshold has been set at 1000 Lux:
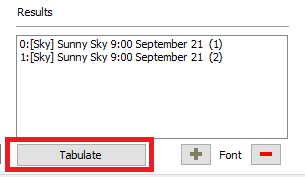
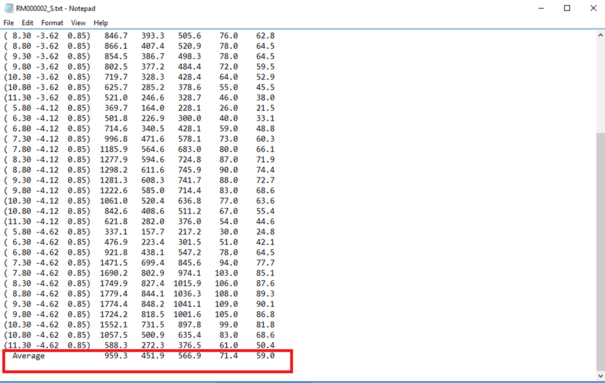
The “Tabulate” output creates a text file showing the results for each grid point with a separate column for each results set [for comparison with DAYSIM].
It also calculates the average for each column.
AOI
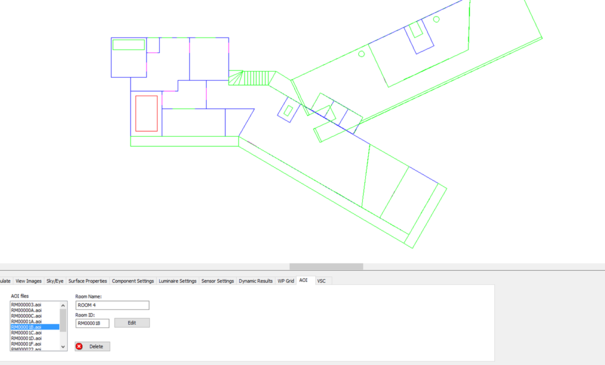
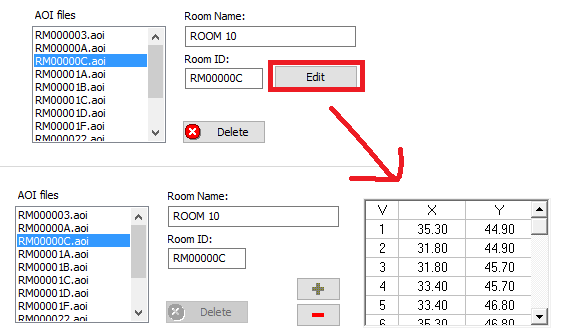
In AOI tab all the areas of interested files created for the model are listed.
Each AOI can be edited by changing its points coordinates after clicking ‘Edit’ button: