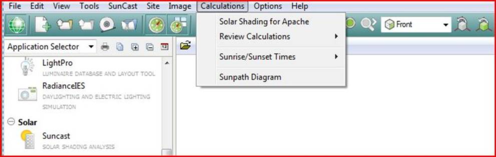
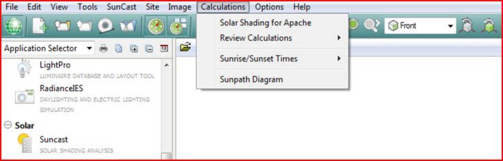
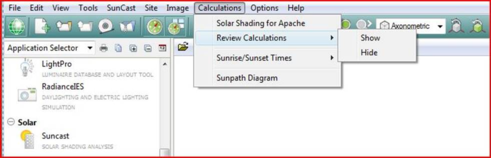
This menu has the following options -
The functions can also be activated from the SunCast toolbar (see section 6).
Solar Shading for Apache
This option is activated from the

button in the toolbar or from the “
Calculations” menu -
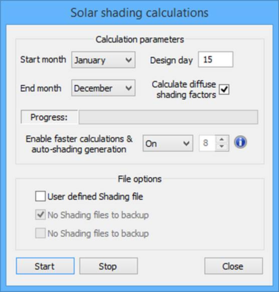
The following window is shown -
From this window the user selects: the time period for the calculations; the design day; the option to include diffuse shading factors; and whether or not to enable faster calculations and automatic shading file generation. There are also several options dealing with shading file output and backup.
Note: To enable faster calculations & automatic shading file generation you must have a multi-core machine and Microsoft’s MPI library installed. For more information on the feature see the infotip

and section 5.9.4 of the Virtual Environment
user manual .
When the shading results have been calculated they are displayed in a flexgrid:
Initially the grid shows the "Solar Altitude" values - when the user selects a particular surface or opening, this shows the insolation data (by default showing the Area of External insolation) -
If the Percentage Area option is selected the grid shows the Area of Insolation as a percentage of the surface area -
The value in the bottom right corner of the grid gives the Annual Average Percentage Area.
Data from previous shading files can be read in using the “File” → “Load Shading Results” menu option.
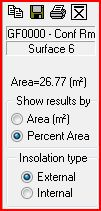
The area to the left of the flexgrid identifies the selected surface and gives two options for the results displayed -
The toolbar options have the following functions -
|
|
Copy the current image to the clipboard.
|
|
|
Save the images
|
|
|
Print the image.
|
|
|
Text report of average % exposure for each surface and opening.
|
This example shows the “Internal” insolation -
This example shows the “External” insolation -
The display of this data can be switched from the “Calculations” menu -
Sun Up/Down Data
This option is activated from the

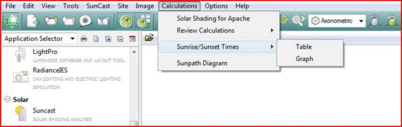
button on the toolbar or from the “Calculations” → “Sunrise/Sunset Times” menu -
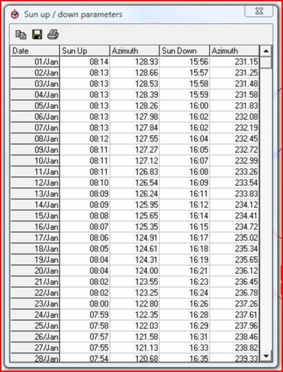
This shows for each day of the year the “Sun Up” time and azimuth and the “Sun Down” time and azimuth.
The toolbar buttons have the following functions –
|
|
Copy the current data to the clipboard.
|
|
|
Save the data to file.
|
|
|
Print the data.
|
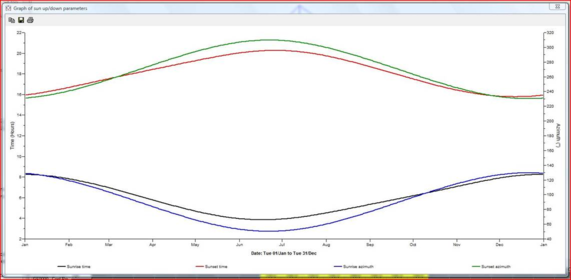
Sun Up/Down Graph
This option is activated from the

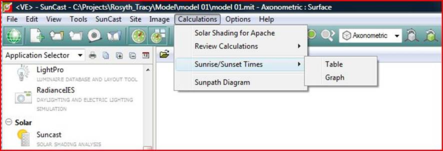
button on the toolbar or from the “Calculations” → “Sunrise/Sunset Times” menu -
The toolbar buttons have the following functions -
|
|
Copy the current data to the clipboard.
|
|
|
Save the data to file.
|
|
|
Print the data.
|
SunPath
The SunPath program is run by activating the

button on the toolbar or from the “
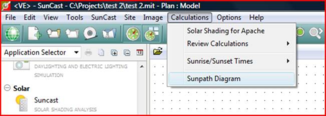
Calculations” menu -
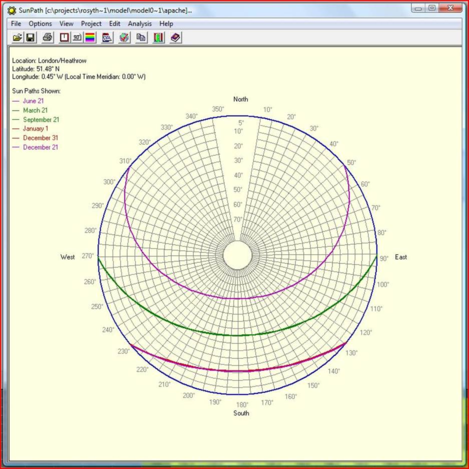
The diagram represents the sky with the apparent paths of the sun shown for one or more days. Compass directions are shown round the outside of the diagram (these give the azimuth of the sun), and each of the internal circles represents altitude. This gives a plot of the sun’s course for the given days.
The selected location (if any), the latitude and the longitude of the observer are also displayed at the top left.
For more details on SunPath see the separate document on this program.