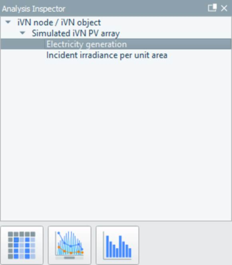
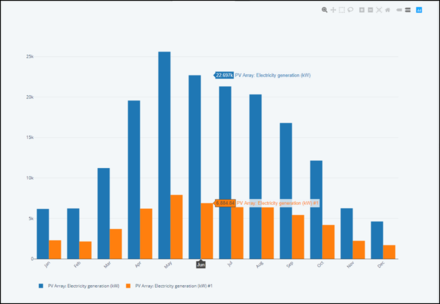
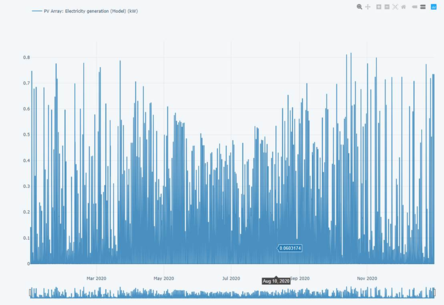
The analysis inspector (Figure 3-51) is used to view simulation results using a variety of different plotting tools. In a similar manner to the data inspector, the analysis inspector shows results variables only for the current selection set in the object browser. Results variables are selected from the list and can then be displayed by clicking a button at the bottom of the window (examples of plots are shown in Figure 3-52 and Figure 3-53).
Figure3-51:Analysis inspector showing the results variables for a heat generator. The buttons at the bottom of the inspector are, from left to right, table, line chart and bar chart. .
Figure3-52:Bar graph displaying the monthly aggregated electricity generation of a PV array installation for twoscenariomodels in the analysis inspector
Figure3-53:Line graph displaying the electricity generation a PV array installation as a function of time