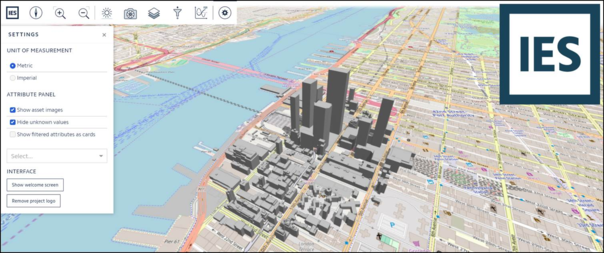
Figure 4.2.4.a: iCIM Toolbar
The iCIM toolbar consists of the following tools:
Home
This has dual functionality.
· It indicates the direction of the view. When the project is opened, it will point in the North/South direction.
· It is also used to revert the model back to the original opening/welcome page position i.e. Birds eye view of the project in the North/South orientation.
Zoom in or Zoom out
This is used to adjust the image.
Clicking on the “plus sign” will zoom in to the model or enlarge the view of the model.
Conversely clicking on the “minus sign” will zoom out of the model or make the view of the model smaller.
Sun 
This is used to generate shadows for the model.
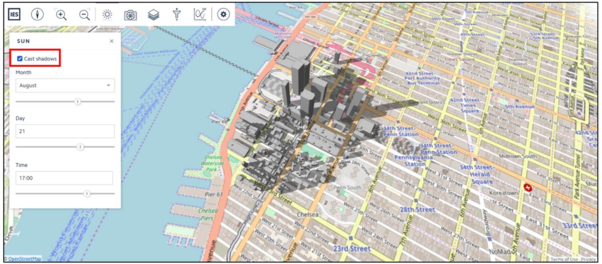
To be able to view the shadow check the box against “Cast Shadows”. Immediately object shadows will appear on the model based on the default Month/Day/Time selection.
The user can scroll along the bar to select a specific month, day and time to view the shading in the model for any particular month/day/time.
Figure 4.2.4.b: iCIM – Sun Tool
Scenes
The user can create new scenes based on the way they want to view the model. Any number of scenes can be created and saved for future use.
To be able to do this the user need to follow the steps below:
· Use pan, zoom and orbit to set the view most appropriate for the project requirements. See the 4.1 welcome screen in case help is needed with the navigational tools.
· Next click “Save Current Scene”
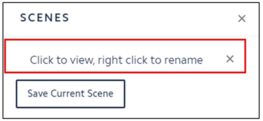
· The user will be prompted to “Click to view, right click to rename”. To give the scene a specific name, Right click to name the scene. Type in the title of the scene and click Enter to save the scene name.
Figure 4.2.4.c: iCIM – Scenes Tool
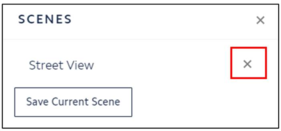
· To delete a saved scene, simply click on the icon next to the scene name and the scene will be deleted.
Figure 4.2.4.d: iCIM – Scenes Tool
Note, the scenes created and saved by a user are automatically saved on the project server and can be viewed by any user who has access to the iCIM project.
Layers
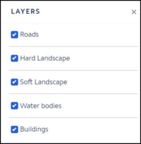
This shows all the layers present in the model such as Roads, Hard Landscapes, Soft Landscapes, Water Bodies, Buildings, and Boundaries etc.
The user can check or uncheck the layers to show or hide the visibility of the layers as seen in the model based on their preference.
Figure 4.2.4.e: iCIM – Layers Tool
Filters 
This has to be used in conjunction with the Analysis tool.
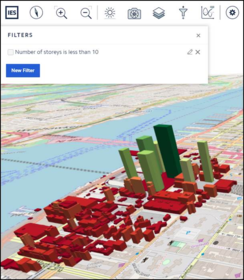
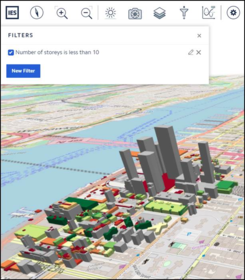
This option is used to create new filters or to create specific data views in the iCIM model. The buildings/objects which satisfies the filter condition will be displayed in the iCIM model while other buildings/objects will be displayed in grey.
To use a filter:
· Select an attribute say number of storeys
· Select Add Condition say is less than
· Select numeric value say 10
· Click save.
Keep the filter checked. Then go to the Analysis tool and select the same attribute to view the results. Images below show the difference when the filter is check and unchecked.
Figure 4.2.4.f: iCIM – Filter Tool – unchecked Figure 4.2.4.g: iCIM – Filter Tool – Checked
Multiple conditions can be created and applied simultaneously within a given project.
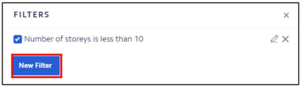
To add more conditions, click on “New Filter”.
Figure 4.2.4.h: iCIM – Filter Tool
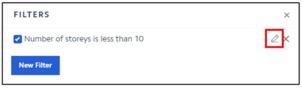
To edit the existing filter, click on the pencil icon against the filter name.
Figure 4.2.4.i: iCIM – Filter Tool
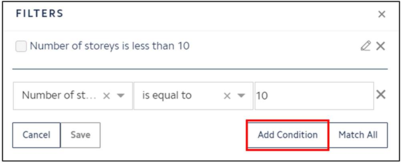
In here, the user has the option of adding a condition. Simply click “Add Condition” and select and type in the variables.
Figure 4.2.4.j: iCIM – Filter Tool
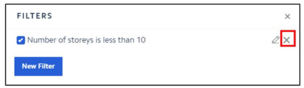
To delete the existing filter, click on the cross icon against the filter name.
Figure 4.2.4.k: iCIM – Filter Tool
A filter with multiple conditions can also be created. To do that the user need to add both the conditions and select the option to match all or match any to the filter.
To understand this let’s use an example:
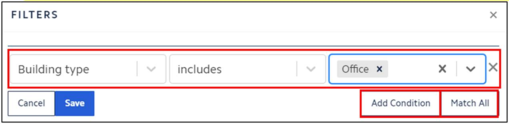
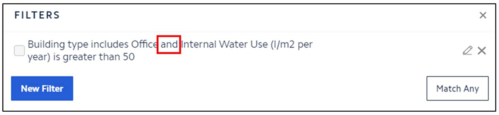
· The first condition created is, that the Building Type includes only Office Buildings
Figure 4.2.4.l: iCIM – Filter Tool
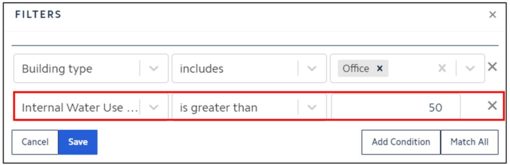
· Now let’s add a condition using the Match All key.
Figure 4.2.4.m: iCIM – Filter Tool
· Save the filter.
· The filter will now use both the conditions to refine the analysis in the metric viewer.
Figure 4.2.4.n: iCIM – Filter Tool
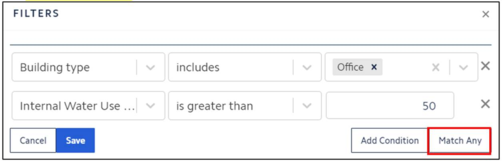
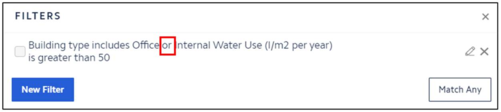
For the same example, lets add two conditions and use the Match Any key
· Save the filter
Figure 4.2.4.o: iCIM – Filter Tool
· The filter will now use any one of the conditions to refine the analysis in the metric viewer.
Figure 4.2.4.p: iCIM – Filter Tool
Note, the filters created and saved by a user are automatically saved on the project server and can be viewed by any user who has access to the iCIM project.
Analysis
The Analysis Inspector uses thematic rendering to view data in the iCIM model. Thematic rendering is used to colour urban feature based on a specific property such as energy consumption, building total floor area and any other numerical or categorical attribute.
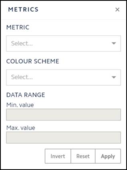
To visualize specific data in the model, select a variable from the drop-down list of each of the below:
· Metric: Select the type of metric or attribute (i.e. object type, number of storeys, total floor area etc).
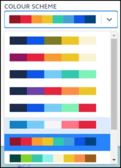
· Colour Scheme: Select the color scheme to be applied based on the user’s requirement. There are a variety of colour palettes to choose from depending on the type of data to be viewed. Select from either the numerical data or category data color schemes. It is recommended that for a numeric metric choose the numerical data colour scheme and for a text metric like building type choose a category colour scheme.
Figure 4.2.4.q: iCIM – Colour Schemes available
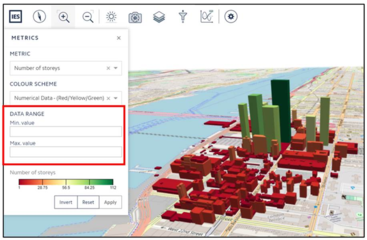
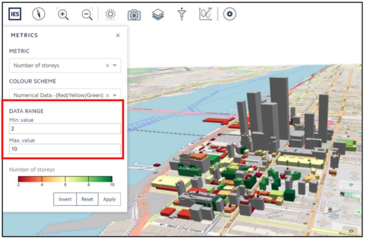
· Data range: Sets the minimum and the maximum value of the displayed data. Any object holding a value out of this range will appear in grey. Images below show the data is visualized when a data range is applied.
Figure 4.2.4.r: iCIM – Analysis Tool – Data Range
Figure 4.2.4.s: iCIM – Analysis Tool – Data Range
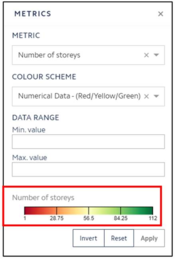
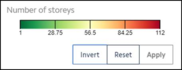
Legend: The legend gives the user a visual reference of the colour scheme.
Figure 4.2.4.t: iCIM – Analysis Tool – legend
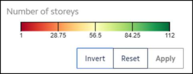
Invert: Clicking on this, inverts the selected colour scheme.
Figure 4.2.4.u: iCIM – Analysis Tool – Invert Figure 4.2.4.v: iCIM – Analysis Tool – Invert
Reset: This resets the analysis inspector and clear all the settings previously selected.
Figure 4.2.4.w: iCIM – Analysis Tool – Reset
Apply: Click on apply to view the options selected in the metric, colour scheme and data range tabs. The user will need to click “Apply” very time a change is made the various metric viewer tabs.
Settings
This is divided into four parts:
· The Units of Measurement
· Boundary Panel
· Attribute Panel
· Interface
Unit of Measurement
The user can select the measuring units for the model from the options available i.e. either metric (meters) or imperial (feet).
Boundary Panel
These are settings for the boundary panel in the iCIM project.
From here the user is allowed to make some changes to the way the boundary panel is viewed. The settings that are allowed to change are:
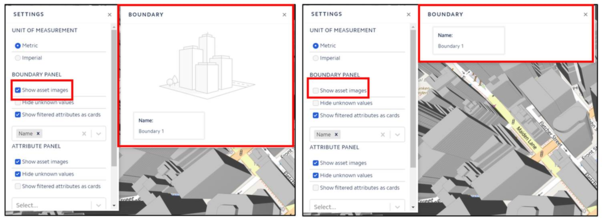
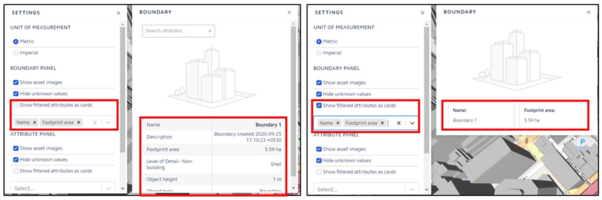
· Show asset images: checking this box allows to displays the uploaded image for the boundary in the project. Images below show the difference.
Figure 4.2.4.x: iCIM – Settings – Boundary Panel 4.2.4.y: iCIM – Settings – Boundary Panel
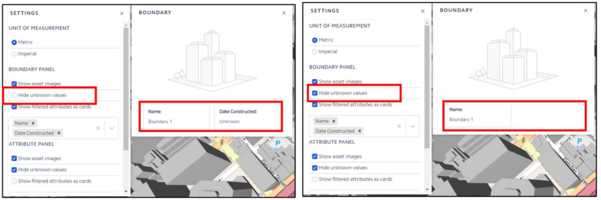
· Hide unknown values: This has to be used along with the “Show Filtered attributes as cards”. Check this box and select the “Show Filtered attributes as cards”, it will hide the attributes of the boundary that don’t have a value. Refer images below to see the differences when the box is checked and unchecked.
Figure 4.2.4.z: iCIM – Settings – Attribute Panel 4.2.4.aa: iCIM – Settings – Attribute Panel
· Show Filtered attributes as cards: Use this to view specific attributes only for the boundary in the model. Select as many attributes that are needed, to do so pick them from the drop-down list or key in the words and they will appear from the drop-down list. Select them. Now go to an object and click on it. Only the attributes selected will be visible for that boundary.
Figure 4.2.4.ab: iCIM – Settings – Attribute Panel 4.2.4.ac: iCIM – Settings – Attribute Panel
Attribute Panel
These are settings for the attribute panel in the iCIM project.
From here the user is allowed to make some changes to the way the attribute panel is viewed. The settings that are allowed to change are:
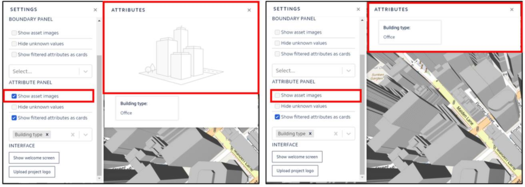
· Show asset images: checking this box allows to displays the uploaded image for the objects in the project. Images below show the difference.
Figure 4.2.4.ad: iCIM – Settings – Attribute Panel 4.2.4.ae: iCIM – Settings – Attribute Panel
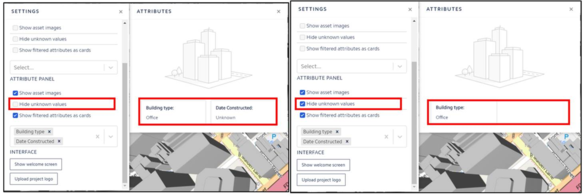
· Hide unknown values: This has to be used along with the “Show Filtered attributes as cards”. Check this box and select the “Show Filtered attributes as cards”, it will hide the attributes that don’t have a value. Refer images below to see the differences when the box is checked and unchecked.
Figure 4.2.4.af: iCIM – Settings – Attribute Panel 4.2.4.ag: iCIM – Settings – Attribute Panel
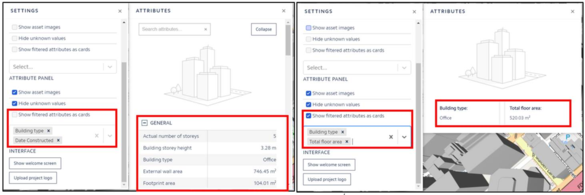
· Show Filtered attributes as cards: Use this to view specific attributes only for the objects in the model. Select as many attributes that are needed, to do so pick them from the drop-down list or key in the words and they will appear from the drop-down list. Select them. Now go to an object and click on it. Only the attributes selected will be visible.
Figure 4.2.4.ah: iCIM – Settings – Attribute Panel 4.2.4.ai: iCIM – Settings – Attribute Panel
Note, the cards saved by a user are automatically saved on the project server and can be viewed by any user who has access to the iCIM project.
Interface
In the interface, there are two options:
Show Welcome Screen: Clicking on this will make the welcome page appear in the center of the screen.
Upload Project Logo: Clicking on this will open the browser to add an image. Brower and select image. Click on “Open”. The project logo will appear in the right corner of the screen.
Figure 4.2.4.aj: iCIM – Settings
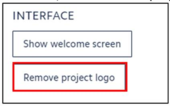
To delete, click “Remove project logo”.
Figure 4.2.4.ak: iCIM – Settings