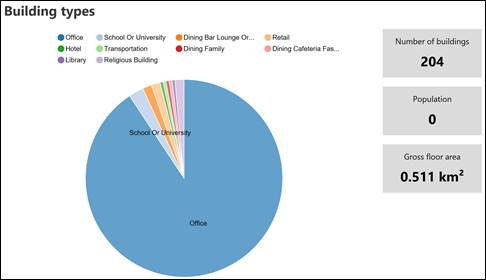
With the help of ready-made reports in iCD extensions, end-users can visualize analysis report of the entire iCD model, with its data related to site, energy, urban design and renewable energy sources.
Figure2-10: reports showing pie chart of building type variation