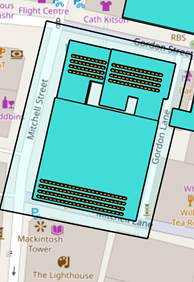
The boundary tool in iCD opens up options to segregate the model based on geographical boundaries the end user is free to create.
The groupings generated and defined as boundaries can be further manipulated (for inclusions and exclusions) for data inspection and allocation.
Similar reports to Model level reports can be generated through the Boundary tool. This allows the end user to visualise data on a restricted number of buildings within boundaries created beforehand.
The visual reports can be generated for the boundary selected for its inspection. Graphical reports can be generated for building details involving data across its site, energy, water, urban planning renewable sources, time series and dynamic attribute.
The primary difference between the reports generated here than in the iCD extensions is, here we can generate boundary level reports instead of entire model reports.
Figure2-11: Boundary generated around the three buildings by defining its vertices.