Parametric tool - analysis
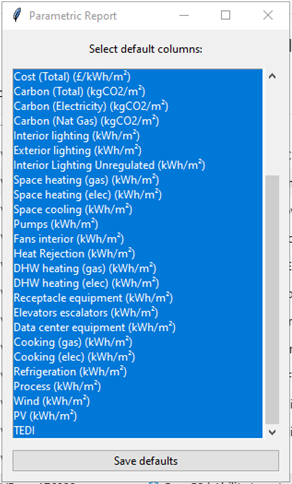
Once the parametric simulation has completed a report columns options dialog is displayed:
Figure: Column options dialog.
The user should select all or a subset of the outputs required (although columns can also be omitted in the report) and then press save defaults. The user is recommended to not select a single default column.
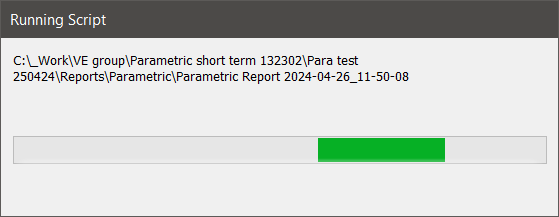
A processing dialog is then shown as the HTML report is generated.
Figure: Report processing dialog.
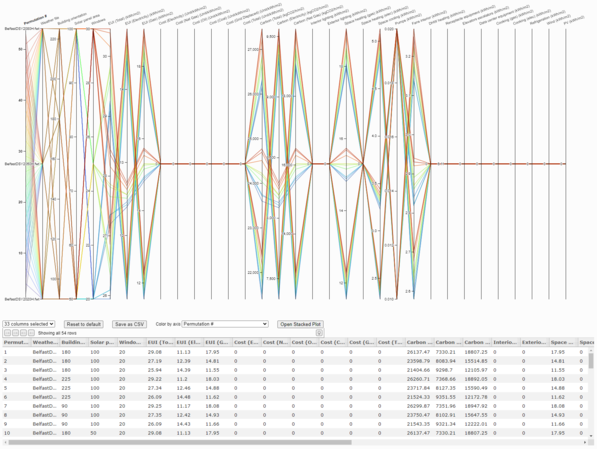
Once completed the report is displayed in the system default browser.
Figure: HTML report with parallel coordinate chart.
The HTML report displays the results as follows:
o Parallel coordinate chart.
o Table of permutations detailing both parameter input values and key results.
o Stacked bar chart (via the Open Stacked Plot button).
The HTML report is interactive and incorporates the results data so:
o Axes can have filters applied, this is achieved by click-drag over axis. Note that just clicking on an axis will make it look like the data has disappeared, this is because it needs the user to drag across an area to select the data to process and a single click provides no data)
o Columns can be omitted/selected (use the columns selected drop-down list).
o Traces can be highlighted by hovering on the permutation # in the table.
o Traces can be coloured by axis.
o The HTML report can be saved and zipped and sent to third parties.
o The HTML data can be saved to CSV (Save as CSV button) for further processing.
o A reset button to return the chart to default settings.
The permutation # can also be utilised in the Parametric tool to apply the desired set of changes back to the current model.
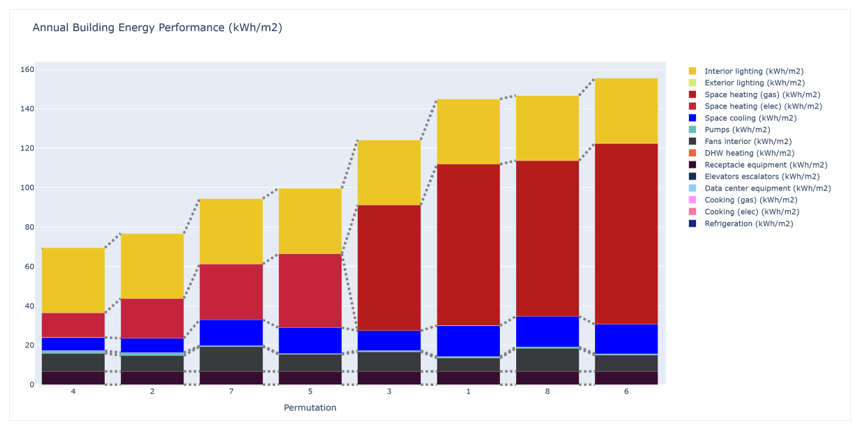
The Stacked bar chart (via the Open Stacked Plot button) plots the end-use data.
Figure: Permutation energy end uses – bar chart.
Note: Once parametric studies get very large the HTML page will slow down.
To open the HTML output after closing the web page use the the Alert Viewer or the Project > Content folder > Parallel Coordinates Report.html (note the web page resources are in a folder labelled Parallel Coordinates Report).