Overview
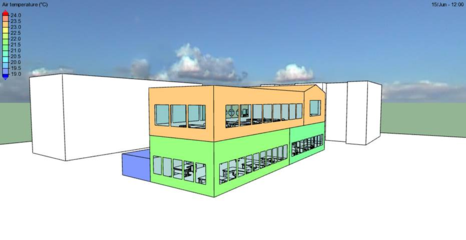
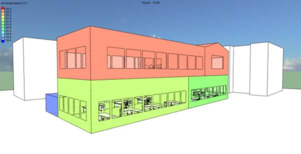
Apache results can be visualised in 3D using the Model Viewer II ‘Visual Analysis’ feature. The feature is similar to the old viewer’s ‘Variable Colour Scale’; however it comes with a few extra enhancements. These include: multiple variable shading (single colour scale); individual variable shading (multiple colour scales); out of bounds shading.
The feature can be accessed through the

button on the VistaPro toolbar

.
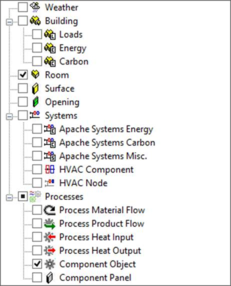
Supported variables include ‘Room’ or ‘Component Object’ variables from Apache results files (.aps).
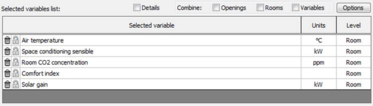
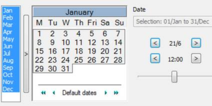
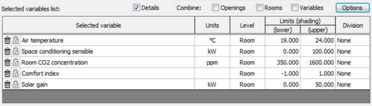
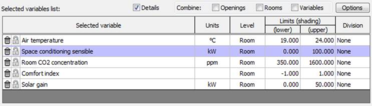
As with the rest of VistaPro, selecting variables is done through the ‘Variables selection’ tree control. Once you have added one or more variables to the ‘Selected variables list’ you can then view them coloured up in Model Viewer II using the Date/Time controls to view particular hourly results.
Any objects that aren’t selected or do not contain results for the selected variable(s) will show up white in the viewer.
Important: When viewing results in Model Viewer II, please be aware that turning shadows on will apply lighting/shading to the model and therefore affect the false colours shown. This means you may not be able to match up the surface colours with the legend colours accurately.
Options
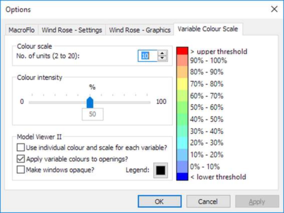
The colours and scale used for colouring results can be changed through the ‘Variable Colour Scale’ tab in the ‘Options’ dialog.
The number of colours used (‘Colour scale’) can be adjusted between 1 and 20 individual colours, with 10 colours being the default. This can be used to change the granularity of results. For example, setting the number of colours to 1 could be used to check whether results are simply within range or out of range. The upper and lower limits of the range are specified and changed in the ‘Details’ section of the ‘Selected variable list’ (see below).
Any value outside the specified range, i.e. above or below will show up red or blue respectively.
The intensity of each colour can also be modified in using the ‘Colour intensity’ slider. This allows you to change the colours used from completely white (0%) to pastel like (50%, the default) and to full colour (100%). Although full white (0%) may not seem useful it can be used to show you what is outside of your specified range.
An option specific to Model Viewer II is ‘use individual colours and scales for each variable’. This means that each variable in the ‘Selected variables list’ will get its own colour scale, with white meaning less than the lower shading limit, and full colour meaning greater than the upper shading limit. When selecting this option you will see the example colour scale change to grayscale.
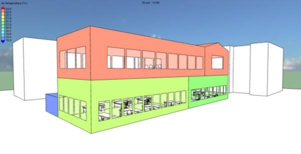
‘Apply variable colours to openings’, which is on by default, means that colours at Room level will be applied to openings (windows and doors) as well as surfaces. This can be handy for example when a room is made up mainly of glazing. See below for an example of the option on and off.
Glazing can also be made solid by turning on the ‘make windows opaque’ option. This is also handy if rooms are mainly made up of glazing.
Lastly, the text colour of the legend in Model Viewer II can also be changed if need be using the button provided. The default colour is black. Changing this colour also changes the legend displayed in the MacroFlo bulk air flow visualization feature below.
Multiple Variables
As mentioned previously multiple variables can be shown in the viewer at the same time. What variables and the way they are shown in the viewer depends on a couple of things.
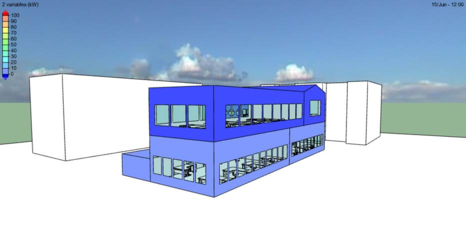
If you have not checked the individual colours and scales option, only variables with the same units as the control variable (highlighted in purple) will be shown using the same (single) colour scale. The scale used will be determined by the control variable’s upper and lower shading limits. You will also notice that the model viewer legend changes to indicate that more than one variable is being used (see below).
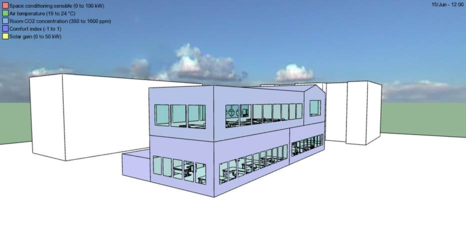
If you have checked the individual colours and scales option, all variables in the list will be shown in the viewer. Each variable will have its own colour and scale applied. The model viewer legend will also update to show a key rather than the colour scale (see below).
Important: If there are multiple variables on the same object, the colour from each individual variable will be combined to provide an average colour. This may not be desirable.
Viewing multiple variables at once is only recommended when each variable applies to a single object, for example: when viewing Component Objects, each of which has its own output.