Overview
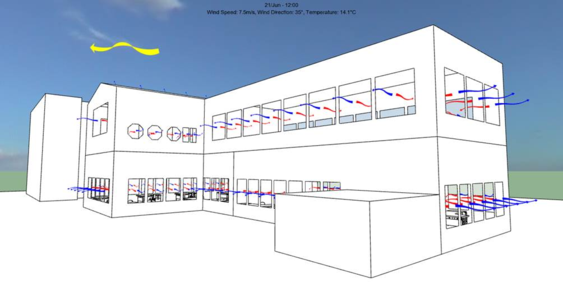
An enhanced version of the MacroFlo bulk air flow visualization, as seen in the old viewer, is now available in Model Viewer II. With much finer grained control over what you want to display, it allows you to: View Opening/Surface Bi or Net Flow; See External Wind Flow; Colour arrows by Room Air Temperature or CO2 Concentration; Apply various filters; Choose from multiple arrows styles; and much more. It can also be used in combination with the ‘Variable Colour Scale’ feature mentioned above.
Access to the feature is through the

button on the VistaPro toolbar

.
To view MacroFlo arrows, your model must have relevant simulation results. See the Apache help manual on ‘MacroFlo Link’ for more details. Once you have results you need to launch Model Viewer II in ‘Visual Analysis’ mode. This will then enable the MacroFlo Arrows button. Upon clicking the button you will be presented with the MacroFlo Arrows dialog as detailed below.
Options Dialog
Once the Options dialog is open, the quickest way to view MacroFlo arrows is to simply enable the feature and then hit the Apply button. This will display the arrows using the set of default settings applied.
You can customize how and what arrows are displayed using the various tabs of options (details below). When happy with your selection just hit Apply to see the changes in the viewer. Settings can be saved for later use as a ‘Display Preset’. Presets can be used in any VE project.
If your model contains a lot of openings, and the viewer becomes cluttered, you can change the ‘View Level’ to reduce the amount of arrows shown.
There are four levels to choose from:
· Opening Bi-Flow - shows an arrow for the flow in and flow out of each opening.
· Opening Net Flow - shows a single arrow in the direction of greatest flow (in or out) of each opening.
· Surface Net Bi-Flow - shows an arrow for the accumulated flow in and flow out of all openings on each surface.
· Surface Net Flow - shows a single arrow in the direction of the greatest accumulated flow of all openings on each surface.
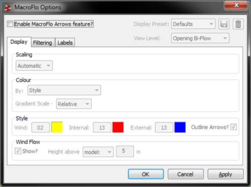
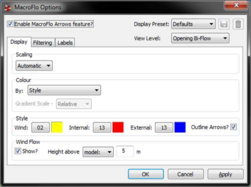
Display
There are various ways to define how arrows are displayed in the viewer, all of which are under the ‘Display’ tab. These options are detailed below.
Scaling
You can change how arrows are sized using the 3 different scaling options: Automatic, Fixed and Manual.
Automatic scaling will adjust the size of the arrows so that they are relative to the minimum and maximum flow in/out values in your model.
Fixed scaling will set the size of all arrows to be the same. You can choose to make them: Small, Medium, Large or Extra Large.
Manual scaling is similar to Automatic scaling however the minimum and maximum flow values used to scale the arrows are defined by you.
Colour
The colour of the arrows can be defined manually (i.e. by Style), or linked to the Room Air Temperature or CO2 Concentration, in which case the ‘variable colour scale’ will be used. The colour will then be determined using the relevant value and the given time step. The scale by default is relevant to the minimum and maximum values in the model; however you can also specify a manual scale.
Style
The type (as well as colour) of arrow used to display Wind, Internal (inside building) and External (outside building) flows can also be changed. There are 16 arrow styles to choose from. An outline can also be applied to the arrows to make them stand out more. This can be useful, for example, when you have variable shading applied to your model as well as arrows.
Wind Flow
The display of wind flow at the current date/time can also be display. The height at which this arrow is displayed can be altered to be above the model or ground at the distance specified by you.
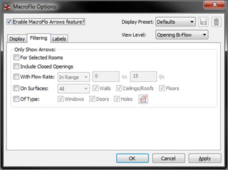
Filtering
What arrows are displayed can be changed using the various options as detailed on the ‘Filtering’ tab.
By default, arrows will be displayed on the entire model; however this can be changed so that arrows on the currently selected rooms are only displayed.
Also by default, any openings which are closed (i.e. have zero flow) will not have arrows displayed on them. You can also change this option so the all options have arrows displayed on them.
Arrows can also be filtered depending on their flow rate. There are 3 options to choose from: within the specified range; above a specified value; or below a specified value.
You can also filter arrows by surface type, for example: to only view arrows on roofs, or to only show arrows on internal/external walls.
Lastly, arrows can be filtered by opening type, for example: to only view flow going through windows of a certain type.
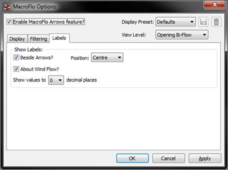
Labels
Information about flow values can also be displayed and can be toggled on the ‘Labels’ tab.
There a two options:
Beside Arrows - allows you to view the flow rate at each arrow (the position and colour of the text can also be changed).
About Wind Flow - allows you to view external weather information like wind speed, wind direction and outside air temperature.
The accuracy of the displayed values can also be changed by altering the number of decimal places.
Note: When viewing flow rates in air changes per hour (ach), Internal values are calculated based on the room the flow is going in to, and External values are based on the room the flow is coming out of.