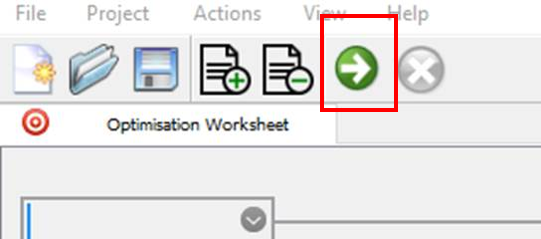
When the Optimisation Worksheet is complete and the objectives have been specified, the user can now run an optimisation study.
Click on the “Start” button.
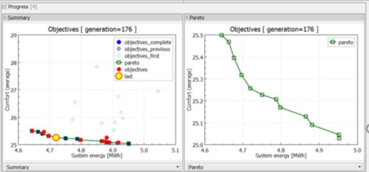
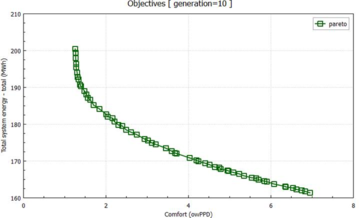
If the user opted to add progress graphs, the user can observe and track the progress of the optimisation study.
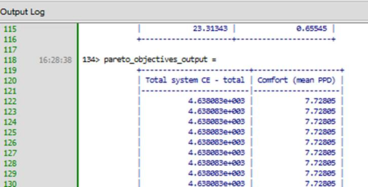
If the user specified to display tables for ‘Pareto variables’ or ‘Pareto Objective values’, they can be displayed in the ‘Output Log’ dialogue.
By referring to the Pareto progress graph, the optimum variable setting is found when the Pareto curve stops varying and the study can be paused by clicking on the ‘Cancel’ button.
The output result file containing the Pareto variables and objective values tables will be saved in the project directory.