Configuring the Hone Worksheet
Once the parameters and variables have been imported, the user can now begin to configure Hone to run an effective optimisation study.
Specifying the Objective
The definition group defines the optimisation problem. An optimisation problem is defined in terms of:
o Objectives – the cost functions of the optimisation problem
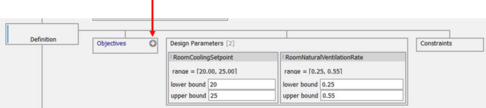
o Design Parameters – the quantities or settings in the model that can be changed
After importing the parameters and variables, one or more objective can be specified. The objectives defines the ‘goal’ or ‘trade-off’ to be explored.
The user will have the option to combine one or more of the following design studies:
- System Energy Consumptions
- Carbon Emissions
- Occupant Comfort
|
Under the ‘Definition’ branch, the user can add one or more objective by clicking the “+”.
|
|
|
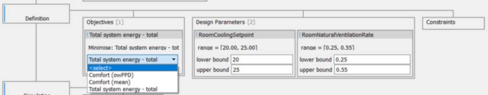
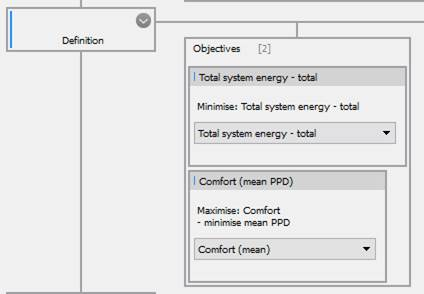
Once an Objective is added, the user can specify the objective by selecting the design study.
The user will be capable of running a multi-objective study by simply adding another objective.
|
|
|
|
Configure Simulation and Optimisation Options
The user may now configure the following options relating to the simulation engine and optimisation routine:
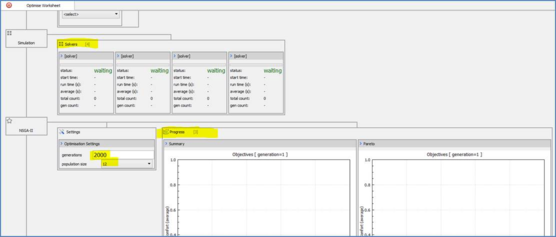
· Simulation Control: Specify the number of Apache simulations to run in parallel (more simulation = more CPU cores and utilisation rate, and quicker convergence time). The example shown in the figure below is using 4 CPU Cores.
· Optimisation Settings: These setting relates to the optimisation routine:
o Generations: The number of evolutionary generations to compute – it is advisable to leave this setting as high as possible as the simulation can be stopped at any time during the optimisation process once satisfactory results have been achieved;
o Population Size: Specifies the number of samples within each generation. This number should be sufficiently large in order to identify optimal evolutionary trajectory (this will vary depending on the number of objectives/constraints and the complexity of the model, but a setting of 32/64 is recommended here).
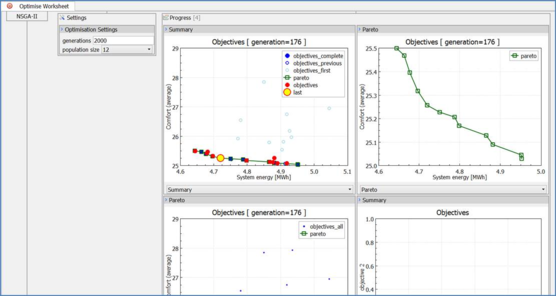
· Progress: Here, the user can specify which charts to display to track progress during the optimisation study:
|
Type
|
Description
|
Example
|
|
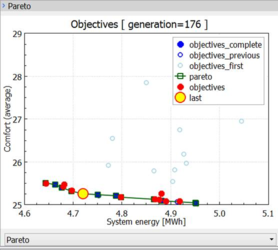
Summary
|
Plot is updated after every evaluation of the cost function. Ie after every variant model has been simulated. Plot shows objective values for the first generation and the last two generations. This is useful to see where the optimisation started and how it is progressing. The red dots should the current generation, ie models that will form the next set of results to be considered by the algoihtm.
The plot includes the current pareto front (green).
|
|
|
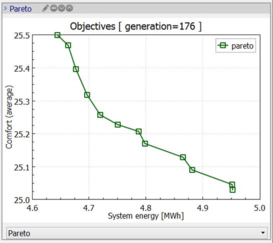
Pareto
|
The current Pareto curve. Updated after each genertion is completed.
|
|
|
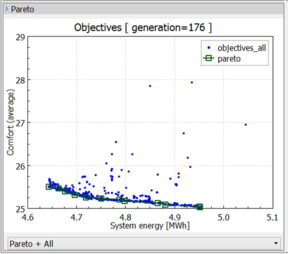
Pareto + All
|
The current Pareto front, plus all model evaluations.
|
|
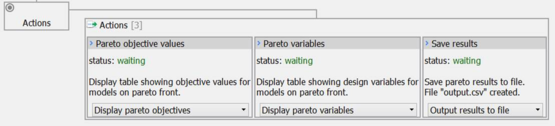
Configuring Actions
Finally, the user may configure what ‘actions’ to perform at different stages of the optimisation (e.g. Display Pareto objectives, output results to file etc.).
The ‘Pareto objective values’ and ‘Pareto variables’ will be displayed in the ‘Output Log’ dialogue of the Hone tool.
Hone - Post-processing actions