The following items describe the menus that are available to the user.
File Menu Commands
The File menu offers the following commands:
New Design
Use this command to create a new Lisi design/simulation.
You can open an existing lift data file with the Open command.
Shortcuts:
Toolbar:

Keys: CTRL+N
Open
Use this command to open an existing lift data file.
You can create new lift data with the New command.
Shortcuts:
Toolbar:

Keys: CTRL+O
The following options allow you to specify which file to open:
· File Name - type or select the filename you want to open. This box lists files with the extension you select in the List Files of Type box.
· List Files of Type - select the type of file you want to open:
o Lisi 'Lifts' file (*.lft).
o Lisi 1.0 file (*.inp) – old version Lisi lift simulation file.
o Filder 1.0 file (*.des) – old version Filder lift design file.
· Drives - select the drive in which Lisi stores the file that you want to open.
· Directories - select the directory in which Lisi stores the file that you want to open.
· Network... - choose this button to connect to a network location, assigning it a new drive letter.
Save
Use this command to save the active lift data to its current name and directory. When you save lift data for the first time, Lisi displays the Save As dialogue box so you can name your lift data file. If you want to change the name and directory of an existing lift data file before you save it, choose the Save As command.
Shortcuts:
Toolbar:

Keys: CTRL+S
Save As...
Use this command to save and name the active lift data file. Lisi displays the Save As dialogue box so you can name your lift data file.
To save a lift data file with its existing name and directory, use the Save command.
The following options allow you to specify the name and location of the file you are about to save:
· File Name - type a new filename to save a lift data file with a different name. A filename can contain up to eight characters and an extension of up to three characters. Lisi adds the extension you specify in the Save File As Type box.
· Drives - select the drive in which you want to store the lift data file.
· Directories - select the directory in which you want to store the lift data file.
· Network... - choose this button to connect to a network location, assigning it a new drive letter.
1, 2, 3, 4 (file names)
Use the numbers and filenames listed at the bottom of the File menu to open the last four lift data files you closed. Choose the number that corresponds with the file you want to open.
Exit
Use this command to end your Lisi session. You can also use the Close command on the application Control menu. Lisi prompts you to save files with unsaved changes.
Shortcuts:
Mouse: Double-click the application's Control menu button.
Keys: ALT+F4
Edit Menu Commands
The Edit menu offers the following commands:
· Copy - copies data from the display to the clipboard.
Copy
Use this command to copy selected data onto the clipboard. This command is unavailable if there is no data currently selected.
Copying data to the clipboard replaces the contents previously stored there.
Shortcuts:
Toolbar:

Keys: CTRL+C
Note this facility is not enabled in version 2.0.
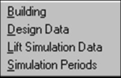
Data Menu Commands
The data menu offers the following commands:
Building Data
Use this command to specify general building specifications, which apply to both design and simulation data.
Shortcuts:
Toolbar:

Keys: none
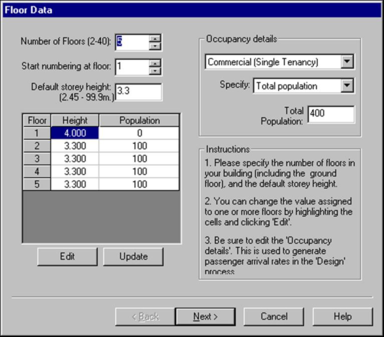
Floor Data (tabbed dialogue)
This dialogue control allows the user to specify fixed parameters for the building. The parameters are described below.
Figure 2 : Floor Data Box
Number of Floors:
Enter the total number of floors in the building, including the main terminal.
Normal range: 2 - 40, error limits: 2 – 40.
Start Numbering at Floor:
Enter the number assigned to the lowest floor (main terminal). This is for labelling and display purposes only.
Normal range: -40 - +40, error limits: -40 - +40.
Default Storey Height:
Enter the default storey height for the building in metres. The default value can be overridden in the floor data grid. The storey heights are used to calculate or estimate the following parameters:
· The building height and hence the round trip distance for a lift car.
· The ‘design’ lift velocity is estimated in relation to building height.
· The ‘design’ start and stop times of a lift car are estimated in relation to its velocity.
The minimum floor-to-floor distances are specified in British Standard BS5655 Part 5. These are as follows:
|
Entrance Height (m)
|
Direction of Door to floor
|
Minimum floor opening distance (m)
|
|
2.00
|
Horizontal
|
2.45
|
|
2.10
|
Horizontal
|
2.55
|
|
2.30
|
Horizontal
|
2.75
|
|
2.30
|
Vertical
|
3.70
|
|
2.50
|
Vertical
|
4.00
|
Units: m, normal range: 2.5 - 7.5, error limits: 2.45 - 99.99.
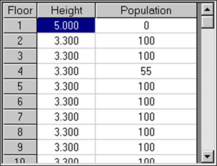
Floor/Height/Population Grid:
This grid allows the user to change the storey height and/or the population for each floor in the building. You can edit a cell in the data grid by either pressing ‘Edit’ after selecting one or more cells, or double-clicking a single cell. Editing one or more cells calls the Editing a storey height dialogue box and the Editing a single-floor population dialogue box.
The grid is updated when you finish changing one of the other building parameters in the Floor Data dialogue box, and either moving the cursor to another control or click Update.
Figure 3 : Floor/height/population grid
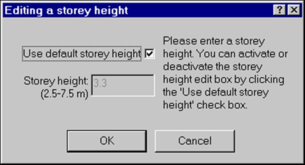
Edit:
Press this button to edit one or more cells selected in the Floor/Height/Population grid while entering data for each floor in the building. The following dialogue boxes will be displayed:
Editing a storey height
This dialogue box allows the user to specify:
· Whether or not the selected floor(s) will use the default storey height.
· What value to assign instead of the default storey height.
Figure 4 : Editing a storey height
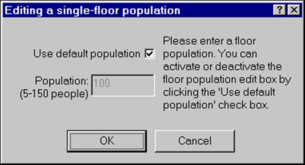
Editing a single-floor population:
This dialogue box allows the user to specify:
· Whether or not the selected floor(s) will use the default population-per-floor generated by the occupancy value entry.
· What value to assign instead of the default number of people-per-floor.
Figure 5 : Editing a single floor population
Update:
Press this button to update the display of all cells in the Floor/Height/Population grid using the current data specified for each floor in the building. Usually, this updating process is automatic, but this button option is included for manual update.
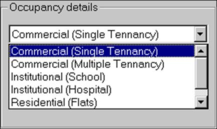
Building Occupancy Type:
Please select the type of building which most aptly describes the type of building/occupancy characteristics for your building.
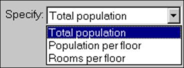
Specify:
Use this list box selection to specify the way in which you want to specify the default Occupancy value. The items listed will depend on the Building occupancy type.
Occupancy Value:
The value that you enter here will depend on the method of data entry selected in Building occupancy type and Specify. These selections will allow you to specify the default population parameters in a number of different ways. After you have specified a new value, it will be applied and distributed amongst the floors using default population values in the Floor/Height/Population grid. It is important to note that the application of this value can be overridden for any specific floor by editing the Population cell in the Floor/Height/Population grid.
The following specifications can be made:
1. Total Population
The specified number of people will be distributed evenly throughout different floors in the building. The nearest population-per-floor value will be chosen and applied. The value that you typed will then be changed to the nearest achievable value.
Normal range: 20 - 3000, error limits: 1 – 4999.
2. Population per Floor
This value specifies the default number of people normally resident on each floor.
Normal range: 5 - 150, error limits: 1 – 1000.
3. Area per Floor
If the population of a commercial building is unknown then the net area (in square metres) of a floor must be entered. The program will then estimate the population of that floor by assuming that there will be 1 person/10sq. metres of net floor area. (Net floor area is the gross area less circulation space, structural support space, service space etc).
Units: sq. metres, normal range: 100 - 50000, error limits: 1 – 999999.
4. Beds per floor
If the population details for a hospital are unknown then the number of beds per floor must be entered here. The program will then estimate the total population by assuming 3 people per bed space.
Normal range: 5 - 1000, error limits: 1 – 9999.
5. Rooms per floor
If the population of a hotel is unknown then the number of rooms per floor should be entered. The program will then estimate the default population-per-floor by assuming 1.75 persons per room.
Normal range: 5 - 500, error limits: 1 – 99999.
Design Data
Use this command to assess different designs for lift arrangements. The Design Assessment dialogue is displayed.
Shortcuts:
Toolbar:

Keys: none
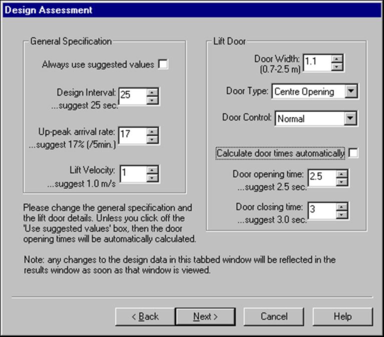
Design Assessment (tabbed dialogue)
This tabbed dialogue allows the user to assess different designs and parameters.
Figure 6 : Design Assessment Dialogue
Adjustments to the design parameters can be made, as described below.
Always Use Suggested Values:
When this box is ticked, then the Design interval, Up-peak arrival rate, and lift velocity will be calculated automatically. Turn the tick off if you want to prevent the automatic calculations and edit the values yourself.
The figures generated by the automatic calculations are always displayed as ‘suggested values’, adjacent to the relevant editable box.
Design Interval:
The Design Interval is the average time between successive lift-car arrivals at the main terminal floor. This interval is therefore a measure of the quality of service offered to the passengers, since it is an estimate of the time which a passenger should wait for a lift. The suggested value is a typical recommended time based upon the building type. The suggested values are as follows:
|
Building Type
|
Design Interval (s)
|
|
Commercial (Single Tenancy)
|
25
|
|
Commercial (Multiple Tenancy)
|
25
|
|
Institutional (School)
|
40
|
|
Institutional (Hospital)
|
40
|
|
Residential (Flats)
|
65
|
|
Residential (Hotel)
|
40
|
Units: s, normal range: 10 - 80, error limits: 2 – 180.
Up-peak Arrival Rate:
The Up-Peak percentage arrival rate is the number of passengers who arrive at the main terminal floor for transportation to the upper floors assuming a worst-case scenario over a five-minute period. For example, in an office block this would normally be the peak percentage of the building population who arrive for work in the morning during a 5-minute period. Modern "Flexitime" working arrangements reduce this percentage since the arrivals will be spread over a longer period. However in a school, for example, there is likely to be a high up-peak percentage since the starting time of the school day is rigid. The value for this Up-Peak Rate is expressed as a percentage of the total building population who arrive during the busiest 5-minute period. The Up-Peak value will therefore depend upon the building type and working arrangements. The suggested value given by the program is selected from the following criteria (not taking account of possible flexi-time arrangements):
|
Building Type
|
Up-peak Percentage
|
|
Commercial (Single Tenancy)
|
17
|
|
Commercial (Multiple Tenancy)
|
15
|
|
Institutional (School)
|
20
|
|
Institutional (Hospital)
|
10
|
|
Residential (Flats)
|
6
|
|
Residential (Hotel)
|
12.5
|
Units: % population/5 mins, normal range: 5 - 25, error limits: 1 – 100.
Lift Velocity:
The value of the lift velocity (or contract speed) in metres per second is the maximum speed at which the lift will travel. Clearly this will have an effect upon the round-trip time of a lift car and hence the design interval. The velocity of the lift will be partly dependent upon the lift application and the building height. The suggested value which appears is based upon the total height of the building calculated from the storey heights entered previously. The suggested values are calculated as follows:
|
Contract Speed (m/s)
|
Max. Building Height (m)
|
|
0.63
|
<13.0
|
|
1.0
|
20.0
|
|
1.6
|
32.0
|
|
2.5
|
50.0
|
|
3.15
|
63.0
|
|
4.0
|
75.0
|
|
5.0
|
100.0
|
|
6.0
|
120.0
|
|
7.0
|
>120.0
|
This table generally only applies to commercial office buildings, so make sure that the default value is suitable for the application. To override the default simply enter a new value for the velocity in metres per second. For further guidance on lift velocity, British Standard BS5655 Parts 5 and 6 should be consulted.
Units: m/s, normal range: 0.25 - 5, error limits: 0.05 - 9.99.
Door Width:
Enter a value for the lift-entrance width in metres. This value will depend upon the lift capacity. Typically the door entrance width is 0.8m, 1.1m, or 1.3m. This value is used in conjunction with the Door Type and Door Control selections to formulate a suggested time taken for the doors to open or close.
Units: m, normal range: 0.8 - 1.3, error limits: 0.7 - 2.5.
Door Type:
You should select the type of door (with relation to the opening mechanism) which is to be applied to your lift design. Valid types are:
|
1.
|
Single Slide - A single sliding panel.
|
|
2.
|
Double Slide - Two telescopic side-opening sliding panels.
|
|
3.
|
Centre Opening - Two doors which open from the centre.
|
You should only use single-slide type doors for door widths less than or equal to 1.1m. These types of doors are used with the Door width and Door control type, to estimate a suggested time taken for the doors to open or close. The centre-opening doors will have the fastest complete operation, followed by the double-slide doors, with the single-slide variety having the slowest complete operation.
Door Control:
You should select the correct door-opening control method for your lift design. The possible options are shown below:
|
1.
|
Ordinary Control
|
Doors open only after lift has stopped moving
|
|
2.
|
Advanced Control
|
Doors begin to open within the unlocking zone as the car approaches a landing
|
The chosen method is used with the, Door width and Door type to generate the suggested time taken for the doors to open or close whilst the lift is stationary. Clearly with advanced control the opening time will be considerably reduced.
Calculate Door Times Automatically
When this box is ticked, then the Door Opening and Door Closing Time will be calculated automatically. Turn the tick off if you want to prevent the automatic calculations and edit the values yourself.
The figures generated by the automatic calculations are always displayed as ‘suggested values’, adjacent to the relevant editable box.
Door Opening Time:
The door opening time is that taken for the doors to completely open after the lift has stopped. If advanced door opening is utilised then this value should be about one third of the time taken for ordinary door control. The suggested value which appears in this cell depends upon the Door width, Door type and Door control method used. The suggested door opening times are based on the following criteria:
|
Door Type
|
Door Width (m)
|
Door Opening Time (s)
|
|
Normal opening
|
Advanced opening
|
|
Single Slide
|
0.8
|
2.5
|
1.0
|
|
1.1
|
3.0
|
1.5
|
|
Double Slide
|
0.8
|
3.2
|
0.9
|
|
1.1
|
3.4
|
1.0
|
|
1.3
|
3.9
|
1.2
|
|
Centre Opening
|
0.8
|
1.9
|
0.5
|
|
1.1
|
2.5
|
0.8
|
|
1.2
|
2.8
|
0.9
|
|
1.3
|
3.0
|
1.1
|
Units: seconds, normal range: 0.6 - 6, error limits: 0.2 - 99.9.
Door Closing Time:
The door closing time is the time taken for the doors to completely close and initiate the lift to start. The default value which appears in this cell depends upon the door width and the door type. The default time is based on the following criteria:
|
Door Type
|
Door Width (m)
|
Door Closing Time (s)
|
|
Single Slide
|
0.8
|
3.0
|
|
1.1
|
4.0
|
|
Double Slide
|
0.8
|
4.0
|
|
1.1
|
4.4
|
|
1.3
|
5.0
|
|
Centre Opening
|
0.8
|
2.2
|
|
1.1
|
3.0
|
|
1.2
|
3.5
|
|
1.3
|
3.8
|
Units: seconds, normal range: 0.6 - 6, error limits: 0.2 - 99.9.
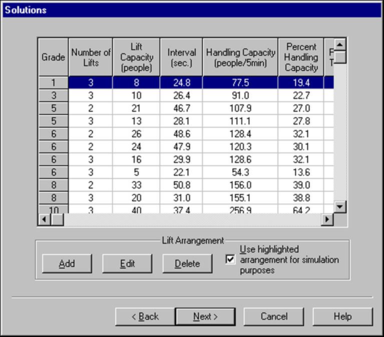
Solutions (tabbed dialogue) :
This dialogue displays different possible lift arrangements for the proposed building and design parameters. The solutions are generated automatically and displayed in the solutions grid. Each solution is graded for suitability and the user can add other possible lift arrangements for assessment.
If you tick the tick box to use the selected lift arrangement for simulation purposes, then the selected arrangement will be applied to your simulation model, displayed in the main simulation window.
Figure 7 : ‘Solutions’ dialogue
Solutions Grid:
This data grid displays a series of design solutions for the proposed building and design parameters. Each solution is graded from 1-10 on a scale of suitability, with 1 being the most suitable, and 10 being the least suitable.
The lift arrangements which are automatically generated and assessed by the program are marked as ‘Not’ editable. Those which are added manually are marked as editable. Solutions are graded as soon as they are added to the grid, and are recalculated whenever the dialogue box is re-displayed.
The data displayed on this grid contains the following information for each possible design solution:
|
1.
|
The proposed number of lifts
|
|
2.
|
The capacity of each lift (number of standard ‘person’ sizes)
|
|
3.
|
The calculated interval between lift car arrivals
|
|
4.
|
The handling capacity of the lift arrangement over a 5 minute period
|
|
5.
|
The percentage of the population (above the lowest floor) which can be handled over a 5 minute period.
|
|
6.
|
An indication of whether the lift arrangement is directly editable or automatically generated for assessment.
|
Add:
Press this button to add a new possible design solution to the solutions grid. When you add a design solution (lift arrangement) to the solutions grid, then you need to specify the number of lifts and the capacity of each lift.
Edit:
Press this button, or double click a selection on the solutions grid, to edit a design solution (lift arrangement). When you edit a lift arrangement, then you need to specify the number of lifts and the capacity of each lift.
If a non-editable lift arrangement is selected for editing, then a new arrangement is added to the Solutions grid.
Delete:
Selecting this button will delete an editable design solution from the solutions grid, if one is selected.
Use Highlighted Arrangement for Simulation Purposes:
When this box is ticked, then the data selected in the solutions grid will be used as the basis for a new simulation. The lift simulation data and the time period data will then be changed to reflect this selection, and will be subject to a number of automatic calculations. You should check the automatically generated data before carrying out a simulation, to ensure that the default values are correct for your particular building and level of passenger service.
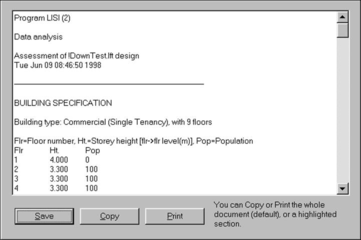
Results Output (dialogue)
This dialogue displays the currently active design and simulation data, for viewing and output, as desired. You can edit the data manually in the text display box. If you highlight a particular section of the results output, then only this section of the data will be selected for printing. Otherwise, all the output data selected is to be saved to file, copied or printed.
Figure 8 : 'Results Output' dialogue
The following buttons can be pressed to output the results:
Save:
Press this button to save the results output to a text-based output file.
Copy:
Press this button to copy the results output to the Windows clipboard, for pasting into word processors, spreadsheets etc.
Print:
Press this button to send the selected results output to a printer. The printing process uses the standard windows dialogue boxes to control the printing process.
Lift Simulation Data
Use this command to change technical parameters for the lifts, to be applied to simulations only. The ‘Editing Lift Simulation Data’ is applied.
Shortcuts:
Toolbar:

Keys: none
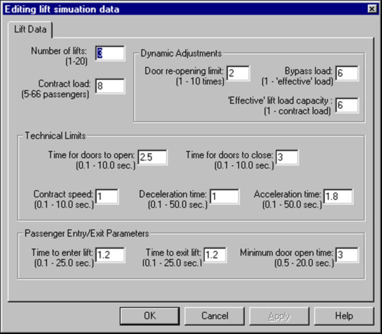
Editing Lift Simulation Data (tabbed dialogue)
Use this dialogue box to change the technical parameters for the lift simulation only.
Figure 9 : 'Editing lift simulation' tabbed dialogue
The following data items can be accessed:
Number of Lifts:
Enter the number of lifts you wish to have in the lift system for the building, up to a maximum of 20. All lifts will be assumed to be identical with the same door opening and closing times, velocity, acceleration and deceleration rates, etc.
Normal range: 1-10, error limits: 1 – 20.
Contract Load:
Enter the contract load of the lifts. This is the maximum number of passengers that can be carried in one lift. Current carrying capacities recognised in British Standards (BS5655 Part 5) are:
5, 6, 8, 10, 13, 16, 20, 21, 24, 26, 33, 40, 53, 66.
Lifts with contract loads of less than 10 should generally not be used in any commercial premises. In some cases, guidance absolutely forbids the use of lifts with contract loads of 5 people, because these may not be large enough for wheelchair users.
Generally, contract loads 10 to 21 are suitable for the carriage of passengers in residential buildings, banks, hotels, offices, etc. but often a lift with a contract load of 13 is preferable to 10 in order that large objects can be carried on the lifts. Larger lifts are suitable for the carriage of passengers, beds, goods, etc. in hospitals, factories and warehouses, etc. Particular reference should be made to Table 7 of BS5655 Part 5 if considering loads of 6, 20, 40, 53, or 66. These are generally slow goods lifts with collapsible or vertical sliding doors.
IMPORTANT: Consult the guidance before making a final recommendation about lift size, especially if the contract load is less than 13 people. British Standard BS5655 Parts 5 and 6 should be consulted.
Normal range: 8 - 33, error limits: 1 – 66.
Bypass Load:
Enter the bypass load. When the contents of the lift are equal to or exceed this value, the lift will not stop at another floor for more passengers, but the call will be maintained for the next convenient time.
Normal range: (contract load*0.5) - (effective load), error limits: (1) - (effective load).
Effective Lift Load Capacity:
Enter the ‘effective’ lift load capacity i.e. the passenger load at which no more passengers will enter the lift because they are reluctant to get in, due to the severe crowding.
Early versions of Lisi assumed an effective lift load capacity which was equal to the contract load. It is perhaps more realistic to assume that people are reluctant to fill the lift to absolute capacity, and that a more realistic value for the effective capacity is 80 percent of the contract load. When the simulation data is generated automatically, then the effective load is automatically calculated to be the closest integer value to 80% of the contract load.
Normal range: (contract load*0.5) - (contract load), error limits: (1) - (contract load).
Door Re-opening Limit:
Enter the maximum number of times the doors may re-open on the same floor for passengers arriving just after the doors have closed. Doors will remain open until the lift is full or until completion of embarkation and disembarkation, whichever occurs first.
Normal range: 2 - 4, error limits: 1 – 10.
Time for Doors to Open:
Note this value will have been set if you have already been through the design procedure, and you shouldn’t need to change it.
If you need to change this value, please enter the time taken for the lift doors to open in seconds. This should be for the actual opening operation only and should not include any time for delay or embarkation/disembarkation which will be established by the program depending upon the number of passengers waiting, etc. at that time. The door opening times will depend upon a number of factors, e.g. the type of door operator and the door width which will in turn depend upon the contract load. Some general guidelines are given below:
|
Contract load (people)
|
Typical door width (m)
|
Time for doors to open (s)
|
|
Normal range
|
Nominal
|
|
5 - 13
|
0.8 - 1.1
|
1.2 - 4.0
|
2.0
|
|
16 - 33
|
1.1 - 1.7
|
1.3 - 5.0
|
2.5
|
|
33 - 66
|
1.3 - 2.5
|
2.5 - 6.0
|
3.5
|
If a high speed door opener is required then the fastest time should be specified, but nominal door opening times should generally be appropriate. It should be noted that centre-opening doors will be open quicker than single slide and two speed side opening doors.
Units: seconds, error limits: 0.1 – 10.
Time for Doors to Close:
Note this value will have been set if you have already been through the design procedure, and you shouldn’t need to change it.
If you need to change this value, please enter the time taken for the lift doors to close in seconds. This should be for the actual closing operation only and should not include any time for delay or embarkation/disembarkation which will be established by the program depending upon the number of passengers waiting, etc. at that time. The door closing time will depend upon a number of factors, e.g. the type of door operator and the door width which will in turn depend upon the contract load. Some general guidelines are given below:
|
Contract load (people)
|
Typical door width (m)
|
Time for doors to open (s)
|
|
Normal range
|
Nominal
|
|
5 - 13
|
0.8 - 1.1
|
2.2 - 5.0
|
3.0
|
|
16 - 33
|
1.1 - 1.7
|
3.5 - 5.5
|
4.0
|
|
33 - 66
|
1.3 - 2.5
|
4.0 - 6.5
|
5.0
|
Nominal closing times should generally be appropriate, but it should be noted that centre opening doors will be closed sooner than single-slide and two-speed side-opening doors.
Units: seconds, normal range: 0.5 - 6.5, error limits: 0.1 – 10.
Contract Speed:
Enter the contract speed of the lift. This is the velocity of the lift when operating at full speed. Standard rated speeds (m/s) are given in Section 4.3.2.1.4 (Lift Velocity):
These are only guideline speeds; higher speeds are offered by lift manufacturers. The lowest speeds are appropriate for larger lifts intended for carrying hospital beds, for example, whilst the high speeds are appropriate for intensive passenger traffic in office buildings, etc. The speed will also depend upon the building type and height. Here are some building speed/height guidelines:
Units: m/s, normal range: 1 - 5, error limits: 0.1 - 9.9.
Deceleration Time:
Enter the time taken for the lift to decelerate from full speed to standstill. This will depend upon the deceleration rate being offered by the manufacturer according to the drive arrangements and contract speed. Here are some guidelines to help choose a typical deceleration time according to the contract speed:
|
Contract speed (m/s)
|
Deceleration time (seconds)
|
|
0.63
|
1.0
|
|
1.0
|
1.0
|
|
1.6
|
1.5
|
|
2.5
|
2.0
|
|
3.15
|
2.4
|
|
4.0
|
2.9
|
|
5.0
|
3.4
|
|
6.0
|
4.0
|
|
7.0
|
5.0
|
Units: seconds, normal range: 1.0 - 5.0, error limits 0.1 – 50.
Acceleration Time:
Enter the time taken for the lift to accelerate from standstill to full speed. This will depend upon the contract speed and drive arrangements. Typical acceleration times according to the contract speed are:
|
Contract speed (m/s)
|
Acceleration time (seconds)
|
|
0.63
|
2.0
|
|
1.0
|
1.8
|
|
1.6
|
2.0
|
|
2.5
|
2.6
|
|
3.15
|
3.0
|
|
4.0
|
3.5
|
|
5.0
|
4.0
|
|
6.0
|
5.0
|
|
7.0
|
6.0
|
Units: seconds, normal range: 1.0 - 5.0, error limits: 0.1 – 50.
Time to Enter Lift:
Enter the time taken (in seconds) for a passenger to enter a lift. This will depend upon the type of passenger. In general a passenger transfer time of 1.2 seconds should be appropriate, but if the lift will primarily carry elderly passengers or larger items such as trolley beds, then this time should be increased accordingly.
Units: seconds, normal range: 1.0 - 5.0, error limits: 0.1 – 25.
Time to Exit Lift:
Enter the time taken (in seconds) for a passenger to exit the lift. This will depend upon the type of passenger. In general a passenger transfer time of 1.2 seconds should be appropriate, but if the lift will primarily carry elderly passengers or larger items such as trolley beds, then this time should be increased accordingly.
Units: seconds, normal range: 1.0 - 5.0, error limits: 0.1 – 25.
Minimum Door Open Time:
Enter the minimum door open time in seconds. The doors will remain open for this length of time even if embarkation and disembarkation is complete before this time has elapsed. They will however remain open longer than this time to allow for the completion of embarkation and disembarkation if necessary.
Units: seconds, normal range: 2.0 - 6.0, error Limits: 0.5 – 20.
Simulation Periods
Use this command to access and edit the different time periods during a simulation.
Shortcuts:
Toolbar:

Keys: none
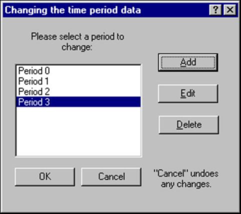
Changing the Listed Simulation Periods (dialogue box)
The simulation can be broken down into a number of timed periods, each describing the passenger traffic in terms of passenger arrival rates and distributions, etc. The traffic data is assumed to be constant over the specified period.
During a simulation, the model processes each period consecutively, with passengers remaining from one simulation being carried over to the next. Data concerning the passenger service and activities is stored at the end of each period. When a simulation is complete, then the simulation results for all periods can be viewed and output to your chosen media.
The incremental time step for the simulation is one tenth of a second. It is unnecessary therefore to specify any times to a greater accuracy.
Figure 10 : 'Changing the time period data' dialogue box
You can add, edit and delete the listed simulation periods.
Add:
This command adds a new timed simulation period to the list.
Edit:
This command allows you to edit all traffic parameters etc. for the currently selected timed simulation period. The Editing a simulation time period dialogue box is displayed.
Delete:
This command removes and deletes the selected timed simulation period from the list.
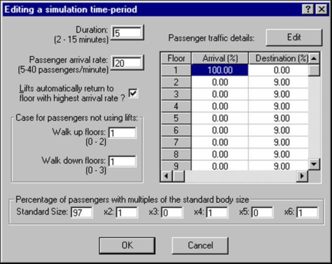
Editing a Simulation Time Period (dialogue box)
Figure 11 : 'Editing a simulation time-period' dialogue box
This dialogue box allows you to edit all parameters relevant to a specific timed simulation period. The items are listed below:
Duration:
Enter the duration of this period of the simulation in minutes. Periods can be up to a maximum of 90 minutes in length and there is no software limit to the number of periods that may be specified. This feature is useful since it allows different periods of the day to be simulated.
Units: minutes, normal range: 2 - 15, error limits: 1 – 90.
Passenger Arrival Rate:
Enter the arrival rate for this period of simulation in passengers per minute. This is the average rate at which passengers arrive to use the lifts and it must include those people who are prepared to use the stairs for short journeys.
The actual intervals between arrivals will be automatically generated randomly by the program according to the normal-distribution curve. Hence if an arrival rate of 10 passengers per minute is specified then the average arrival time will be 6 seconds, but the actual arrival interval will be within the range 0 to 12 seconds.
In the simulation results, the actual number of passengers served is given. This will normally be different from the number of arrivals, due to varying queue lengths and lift contents between periods.
Units: Passengers/minute, normal range: 5 - 40, error limits: 1 – 200.
Lifts Automatically Return...?:
This is a useful feature which states that during certain simulation periods, lifts which are not empty and not responding to a lobby call, will automatically return to the floor with the highest anticipated demand (i.e. the floor with the highest percentage of passenger embarkation).
Walk-Up Floors:
Enter the number of floors passengers are prepared to walk up via the stairs during this period instead of using the lifts. Passengers using the stairs must be included in the arrival rate.
Note all passengers requiring going up this number of floors are assumed to walk, whether or not a lift is available.
Normal range: 0 - 2, error limits: 0 - (number of floors - 1).
Walk Down Floors:
Enter the number of floors passengers are prepared to walk down via the stairs during this period instead of using the lifts. Passengers using the stairs must be included in the arrival rate.
Note all passengers requiring going down this number of floors are assumed to walk, whether or not a lift is available.
Normal range: 0 - 3, error limits: 0 - 0 - (number of floors - 1).
Passenger Traffic Details Data:
This data grid allows you to specify passenger arrival and destination floors for the duration of the relevant simulation time period. The first column identifies which floor each percentage data item is to be applied to. The ‘Arrival %’ column specifies the percentage of people who will normally arrive in the building at the corresponding floor (usually the ground floor). The ‘Destination %’ column specifies the percentage of the population who are destined to reach a particular floor. This is indicative of the ‘resident’ population on that floor.
A typical simple distribution pattern would consist of 100% of occupants arriving on the lowest floor, and an equal distribution of destination percentages on the upper floors.
Highlight one or more cells and click the ‘Edit’ button, or double-click a single cell to edit the percentage value.
Units: %, normal range: 0 - 100, error Limits: 0 – 100.
Edit (passenger traffic details):
Click this button to edit the selected cell(s) in the Passenger traffic details data grid. This allows you to type in and apply a new percentage value to your selection.
Units: %, normal range: 0 - 100, error limits: 0 – 100.
Percentage of Passengers with Multiples of the Standard Body Size:
Enter the percentage of passengers at each of the given sizes 1 to 6. The majority of the population will be size 1, but if the lift system will carry passengers in wheelchairs, or trolley beds, etc., then the increased size of this traffic must be accounted for here. For example if 80% of the population is size 1 and 20% is size 2 then enter 80 for size 1 and 20 for size 2. Enter zero for other sizes if these will not be carried in the lift system. The total percentage must add up to 100% of the building population and only integer values will be accepted.
Units: %, normal range: 0 - 100, error limits: 0 – 100.
View Menu Commands
Sample image:
The View menu offers the following commands:
Toolbar
Use this command to display and hide the Toolbar, which includes buttons for some of the most common commands in Lisi, such as File Open. A check mark appears next to the menu item when the Toolbar is displayed.
See Toolbar for help on using the toolbar.
The toolbar is displayed across the top of the application window, below the menu bar. The toolbar provides quick mouse access to many tools used in Lisi,
To hide or display the Toolbar, choose Toolbar from the View menu (ALT, V, T).

Open a new lift data file.

Open an existing lift data file. Lisi displays the Open dialogue box, in which you can locate and open the desired file.

Save the active lift data file or template with its current name. If you have not named the lift data file, Lisi displays the Save As dialogue box.

Edit the building data. Lisi displays the Floor Data tabbed dialogue.

Assess a series of different possible designs. Lisi displays the ‘Assessing different possible designs’ dialogue box.

Edit the lift simulation data. Lisi displays the ‘editing lift simulation data’ dialogue box.

Edit the simulation periods. Lisi displays the ‘Changing the time period data’ dialogue box.

Start a simulation, using the currently set data.

Pause a simulation.

Stops a simulation, and resets all dynamically changing simulation data to the original values.

Displays the simulation results tabbed dialogue box.

Print the active lift simulation image.

Obtain help on a menu item to be pointed at with the mouse.
Status Bar
Use this command to display and hide the Status Bar, which describes the action to be executed by the selected menu item or depressed toolbar button, and keyboard latch state. A check mark appears next to the menu item when the Status Bar is displayed.
The status bar is displayed at the bottom of the Lisi window. To display or hide the status bar, use the Status Bar command in the View menu.
The left area of the status bar describes actions of menu items as you use the arrow keys to navigate through menus. This area similarly shows messages that describe the actions of toolbar buttons as you depress them, before releasing them. If after viewing the description of the toolbar button command you wish not to execute the command, then release the mouse button while the pointer is off the toolbar button.
The right areas of the status bar indicate which of the following keys are latched down:
· CAP - the Caps Lock key is latched down.
· NUM - the Num Lock key is latched down.
· SCRL - the Scroll Lock key is latched down.
Simulation Results
Use this command to display the Simulation Results tabbed dialogue. This tabbed dialogue allows the user to display/print/copy or save the simulation results. The results are displayed in different formats in the form of ‘Queue Times’, ‘Maximum Queues’, ‘Results Output, which are described below.
This menu command is automatically called at the end of a simulation, in order that the user can view the results immediately.
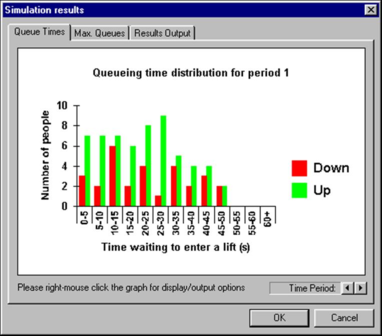
Queue Times (dialogue)
This dialogue box displays the distribution of queuing times encountered by passengers in each period of a simulation. The time that each passenger had to wait before entering a lift is displayed on the axis, in classification bands of 5 seconds. The number of people whose waiting times lie within each range are given on the y axis. The Up and down legends state which bars correspond to queues of people waiting to travel either upwards or downwards in a lift.
The time period displayed can be changed by clicking onto the Time period spin-buttons in the bottom left corner of the dialogue box.
Figure 12: Queue Times dialogue box
Note all printing, copying, saving etc. of the charts is handled by right-mouse clicking the chart image, to display the output options as a pop-up menu.
This data is presented in text format in the results output dialogue box.
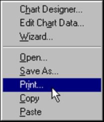
Display and Output Options for Charts (pop-up menu)
This pop-up menu displays the different options available for outputting a chart.
Chart Options menu:
The options are described below:
|
Chart Designer
|
Enables the changing of all aspects of the chart appearance before output. Note that these options are not preserved when the chart dialogue is closed or a different table selected. A new chart is generated whenever a new chart is selected to be displayed.
|
|
Edit Chart Data
|
Enables the displayed data to be adjusted prior to output. Again, the changes made here are not preserved when different tab or results screen is selected.
|
|
Wizard
|
Enables a new chart to be created in any form specified by the user.
|
|
Open
|
Allows a previously saved chart to be loaded from a file.
|
|
Save as…
|
Allows the chart image to be saved in a number of different standard formats.
|
|
Copy
|
Places the chart into the windows clipboard in 3 different alternate formats (text data, picture, and bitmap). When you wish to paste the chart into a word processor, use Paste special to select which format you want the chart data pasted in.
|
|
Paste
|
Allows additional data to be placed into the chart object.
|
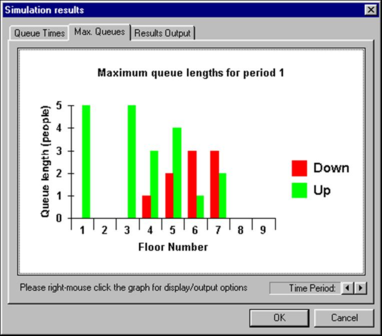
Maximum Queues (dialogue)
This dialogue box displays the maximum queue lengths on each floor for each period of a simulation. The Up and down legends state which bars correspond to queues of people waiting to travel either upwards or downwards in a lift.
The time period displayed can be changed by clicking onto the Time period spin-buttons in the bottom left corner of the dialogue box.
Figure 13: Max. Queues dialogue box
Note all printing, copying, saving etc. of the charts is handled by right-mouse clicking the chart image, to display the output options as a pop-up menu.
This data is presented in text format in the results output dialogue box.
Results Output (dialogue box)
Simulation and design results are listed in a text box, enabling the user to copy, save or print the results.
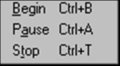
Simulation Menu Commands
Sample image:
The data menu offers the following commands:
Begin
Starts a lift simulation using the currently set data. The simulation can be paused and stopped.
Shortcuts:
Toolbar:

Keys: CTRL+B
Pause
Pauses the currently active lift simulation.
Shortcuts:
Toolbar:

Keys: CTRL+B
Stop
Stops the currently active lift simulation, and resets all dynamically changing variables to the initial values.
Shortcuts:
Toolbar:

Keys: CTRL+B
Help Menu Commands
Sample image:
The Help menu offers the following commands, which provide you assistance with this application:
Help Topics
Use this command to obtain on-line help on any given subject.
About Lisi
Use this command to display the copyright notice and version number of your copy of Lisi.
Context Help
Use the Context Help command to obtain help on some portion of Lisi. When you choose the Toolbar's Context Help button, the mouse pointer will change to an arrow and question mark. Then click somewhere in the Lisi window, such as another Toolbar button. The Help topic will be shown for the item you clicked.
Shortcut:
Toolbar:

Keys: SHIFT+F1
Other Topics
Title Bar
The title bar is located along the top of a window. It contains the name of the application and current data.
To move the window, drag the title bar. Note you can also move dialogue boxes by dragging their title bars.
The title bar may contain the following elements:
· Application Control-menu button
· Maximize button
· Minimize button
· Name of the application
· Name of the data
· Restore button
Scroll Bars
Displayed at the right and bottom edges of the display window. The scroll boxes inside the scroll bars indicate your vertical and horizontal location in the scrolled display. You can use the mouse to scroll to other parts of the display.
The Control Menu
The control menu is displayed when you click the item in the top left of the Lisi application window.
Restore
Use this command to return the active window to its size and position before you chose the Maximise or Minimise command.
Move
Use this command to display a four-headed arrow so you can move the active window or dialogue box with the arrow keys.
Note this command is unavailable if you maximise the window.
Shortcut:
Keys: CTRL+F7
Minimise
Use this command to reduce the Lisi window to an icon.
Shortcut:
Mouse: Click the minimise icon

on the title bar.
Keys: ALT+F9
Maximise
Use this command to enlarge the active window to fill the available space.
Shortcut:
Mouse: Click the maximise icon

on the title bar; or double-click the title bar.
Keys: CTRL+F10 to enlarge a window.
Close
Use this command to close the active window or dialogue box.
Double-clicking a Control-menu box is the same as choosing the Close command.
Shortcuts:
Keys: CTRL+F4 to close the application window