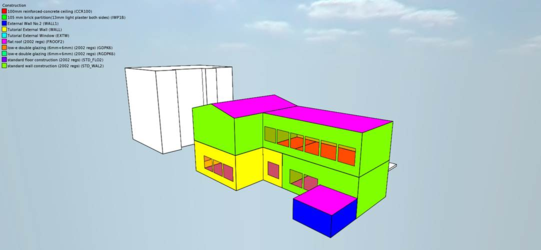
Data assigned to your model can now be visualised as part of the new ‘Input Data Visualisation’ feature in Model Viewer II. The feature allows you to view an assortment of variables from Apache systems to Thermal templates to Internal Gains and much more. A full list of currently viewable data is below.
The feature can be accessed through the button on the Apache toolbar .
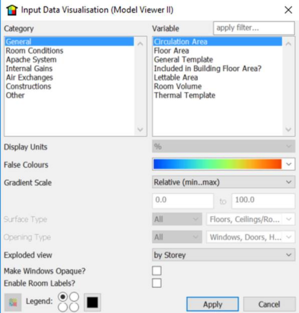
To use the feature you must first select at least one room. The button will then be enabled and upon pressing it you will be presented with the dialog below.
Selecting the variable you want to display and then clicking Apply will launch or update Model Viewer II with your selection.
If you can’t find the variable you’re looking for in the list you can apply a text filter to reduce the number of items shown. This filter applies, regardless of whether you change category or not, until you clear it by clicking on the X button.
Note: Colouring only applies to selected rooms and if the data is available for those rooms. Any rooms not selected or without the specified data will show up white.
Important: When viewing results in Model Viewer II, please be aware that turning shadows on will apply lighting/shading to the model and therefore affect the false colours shown. This means you may not be able to match up the surface colours with the legend colours accurately.
Variable Types
Variables are split into two different types for display. These are detailed below.
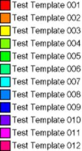
Discrete
Each input is a string value represented by an item on a colour key.
The colours are generated by choosing equidistant points on a colour wheel. Up to 12 different colours are used before a shading pattern is applied. The order in which colours and patterns are applied can be changed to suit your needs. See section 1.4.8 below.
Continuous
Each input is a numerical value represented on a colour scale.
The colour of each input is determined by the ‘False Colours’ and ‘Gradient Scale’ options applied. An example of the UI can be seen above.