13.2. Spatial Daylight Autonomy (sDA)
For sDA, two sets of simulations are run for each window group: one with and one without blinds. It is therefore a requirement to enter two sets of transmissivities for the glazing used in the model: for glazing with blinds, and for glazing without blinds.
A Window Group is defined as co-planar windows having the same shading and operations, i.e. windows on the same façade, currently determined by orientation: North, East, South, West and also horizontal for skylights
To run an sDA simulation; go to the Simulate tab, select the Advanced option, then select Spatial Daylight Autonomy (sDA). The image quality will be set automatically to Dynamic. Then, select the working plane (WP) height and the WP grid dimensions.
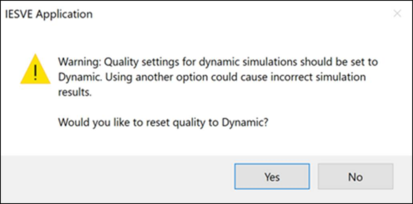
If the image quality is changed subsequently, a warning message will appear that this can affect the results accuracy.
Click Simulate to start the simulation.
Note: there is no modulation control for the window or blind operation. The blind is modelled in its maximum shading position.
The blind is active dependent on a threshold, typically 1000 lux but this can be changed in the post-processing window. The intention is to represent the condition when a blind would be closed due to high incoming light.
LM-83 notes that when a point from the no-blind simulation experiences the threshold at a time-step then this time-step will be substituted with the point value from the blind simulation.
Each time-step is assessed in the same way, such that the end result is a parsed dataset, representing the space performance across the year. This parsed file will be available with the other results files in the Dynamic Results tab. The illuminance (no blind), the illuminance (blind) and the parsed result which sits in between, can be viewed by selecting the appropriate file in the WP Grid tab.
Once the simulation is complete, go to the Dynamic Results tab to process the results.
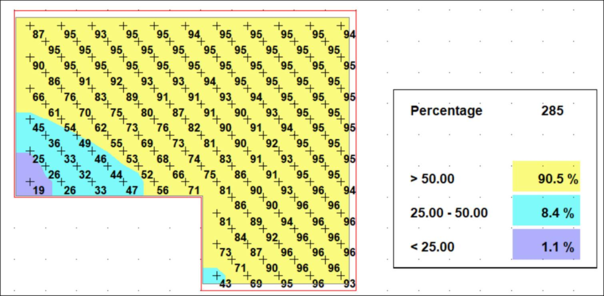
Results are viewed in the WP Grid tab, at desired threshold bands, visualised in 3D or tabulated, for the selected set of results:
· Count > target Lux
· % > Target Lux
· Compliance with number of hours >Target Lux