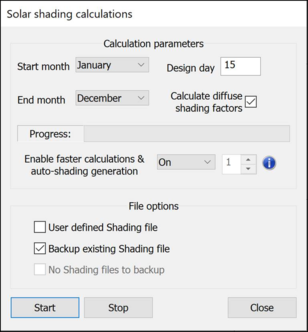
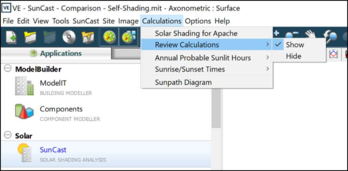
This option is activated from the icon in the toolbar or from the Calculations drop-down menu. The following window is shown:
From this window the user selects: the time period for the calculations; the design day; the option to include diffuse shading factors; and whether or not to enable faster calculations and automatic shading file generation. There are also several options dealing with shading file output and backup.
The data shown for each month in the resultant table, will be for the selected design day as noted at the left of the table.
Note:To enable faster calculations & automatic shading file generation you must have a multi-core machine and Microsoft’s MPI library installed. For more information on the feature see the infotip and section 5.9.4 of the Virtual Environmentuser manual.
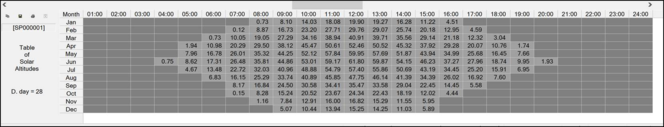
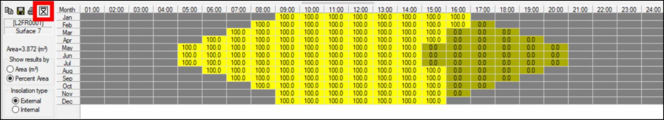
When the shading results have been calculated they are displayed in a flexgrid:
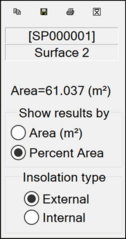
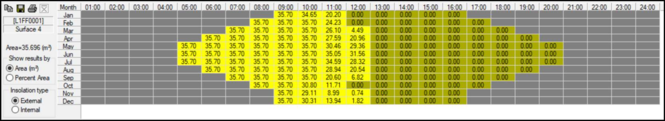
Data from previous shading files can be read in using the SunCast→Load Shading Results menu option. The area to the left of the flexgrid identifies the selected surface and gives options for the results displayed: they can either be shown by absolute area, or a percentage of the total area of the surface, and they can be displayed for either internal or external insolation.
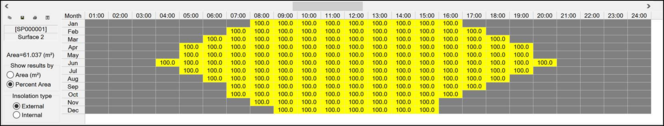
Initially the grid shows the Solar Altitude values - when the user selects a particular surface or opening, this shows the insolation data (by default showing the Area of External insolation):
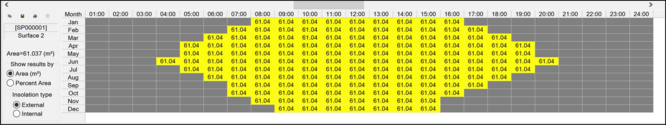
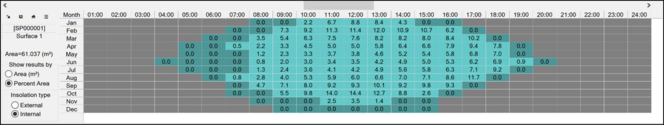
If the Percentage Area option is selected the grid shows the Area of Insolation as a percentage of the surface area:
In either format, if the area or percentage is zero, but the solar altitude is greater than zero, that cell of the grid will be shown in dark yellow, with a zero, to distinguish from the grey cells where the solar altitude is zero.
Externalinsolation is shown in yellow, whereas internal insolation is shown in cyan.
The toolbar options have the following functions:
Copy the current grid to the clipboard. Choose to copy as text if you wish to paste into a spreadsheet, or as an image, to retain colours for reporting purposes.
Save the grid as a *.txt or *.csv format file, not as an image
Print the results.
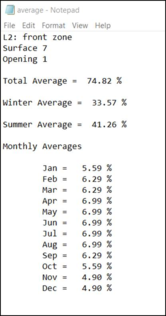
Text report of average % exposure for the selected surface are listed as a total average; summer average; winter average and monthly averages. Where a space is selected, the same data is listed for every surface and opening in the space.
The display of this data can be switched from the Calculations drop-down menu:
To see the average values across a space in the model, after running the solar calculations, click on the average button to the top left of the table when a space or opening has been selected.
This will then calculate the average across the space or opening, and present the results in a pop-up