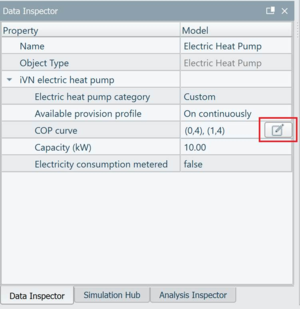
For objects such as an Electric heat pump a COP curve is used to define performance. An editor dialog is accessed by double clicking on the input value, then selecting the edit button that appears in the field (see Figures Figure 3-35 and Figure 3-36).
Figure 3-36: Button for accessing the curve editor when a performance curve is required
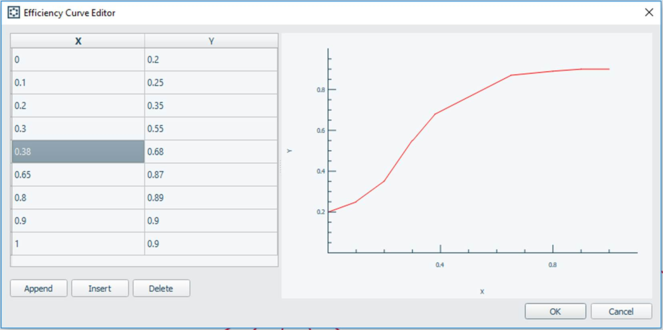
Within the curve editor (Figure 3-37), the “Append” button can be used to add rows of data points used to define the curve to the end of the table. “Insert” will add a row above the currently selected row. “Delete” will remove the currently selected row. Users can edit the X and Y values used to plot the curve by double clicking on the values.
Figure3-37:Efficiency curve editor shown for a heat generator