Area plots are intended to display data where the area under the curve is meaningful. This is the case of power, where the area represent energy (kW to kWh) and flow, where the area represents the volume of water (l/s to l).
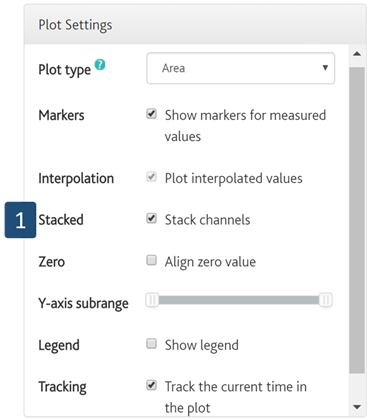
Figure 23: Area plot options.
They have similar options to the line plots with one added option called Stacked (1). This option adds up multiple values. Hence it requires multiple channels to be selected and the same units.
An example of the area plot is presented in figure X The y-axis represents the total power provided from electricity. The area represents the energy used.