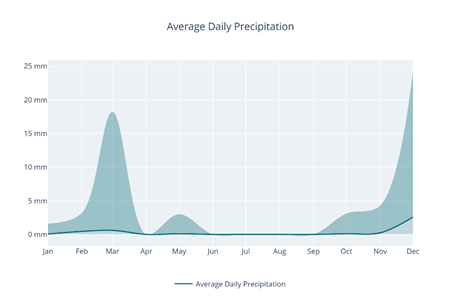
• Average Daily Precipitation: A line graph showing the mean, max, and min daily precipitation for each month
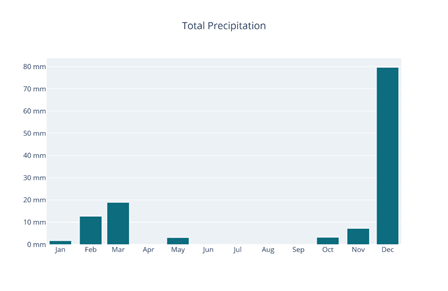
• Total Precipitation: A bar chart displaying the total accumulated precipitation per month and the total annual value (e.g., 126 mm for the example site)