Sunlight exposure offers three options for sunlight exposure assessments:
o The Annual option utilises an annual hourly calculation. Annual probable sunlight hours (APSH) results tabular output is available after the simulation is post-processed using the Simulation options > APSH settings. Results are shown after the simulation or with the results loaded via the menu calculations > APSH table option.
o The Monthly design day option utilises a design day per month hourly calculation. Flex-grid exposure data output is shown after simulation. If all months have been selected the menu calculations > APSH tabular output option can also be utilised. Results are post-processed using the Simulation options > APSH settings but are at a lower resolution than the Annual option; the choice of design day will vary the output.
This option also shows results in the flex grid display
· At model level (no surface selected) solar & cloud data for each month / hour is shown in the Flex-grid.
· At surface level (surface selected) the exposure of a surface is shown in the Flex-grid.
o The Single design day option utilises an hourly or sub-hourly calculation without weather file data i.e. cloudless. Sunlight exposure hours results tabular output is available after simulation or with the results loaded via the menu calculations > Exposure to sunlight table option. This option is utilised in a sunlight provision or exposure to sunlight assessment to BR209 or BS EN 17037.
The Simulation options > Sunlight exposure settings allow the user to define the type of sensor utilised for the calculation (see section 11.3.4): plane, centroid or BR209 (centre of the opening width and at least 1.2 m above the floor and 0.3 m above the sill).
Surrounding obstructions, window reveals and balconies or overhangs above the window affect exposure to sunlight and should be considered.
Sunlight exposure output (.she & .shs files) is not usable with Apache simulations.
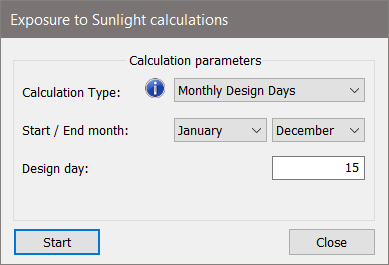
Sunlight exposure is activated from the  icon in the toolbar or from the Calculations drop-down menu. The following dialog is shown:
From this dialog the user selects: the calculation type, the time-period for the calculations; the design day and the timestep if the single day option is selected.
Once a Monthly design day calculation is completed use the Flex-grid to review exposure data at the surface level and the calculations menu option Exposure to sunlight hours to display tabular output.
Note: To enable faster calculations & automatic shading file generation you must have a multi-core machine and Microsoft’s MPI library installed. For more information on the feature see the infotip  and section 5.9.4 of the Virtual Environment user manual.
The data shown for each month in the resultant table, will be for the selected design day as noted at the left of the table.
Note: To enable faster calculations & automatic shading file generation you must have a multi-core machine and Microsoft’s MPI library installed. For more information on the feature see the infotip and section 5.9.4 of the Virtual Environment user manual.
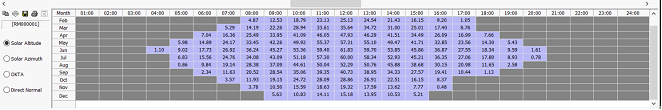
When the shading results have been calculated they are displayed in a flexgrid. Initially, before surface selection the flex grid displays solar data per design day:
Data from previous shading files can be read in using the SunCast → Load Exposure Results menu option.
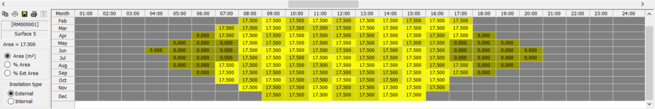
Once a room / surface (use the decomposition tool on the toolbar) is selected the flexgrid changes to display data for the selected surface.
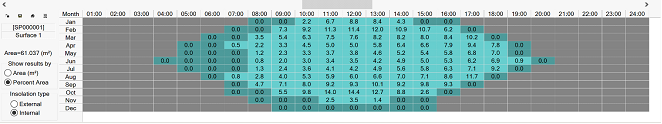
The area to the left of the flexgrid identifies the selected surface and gives options for the results displayed: they can either be shown by absolute area, or a percentage of the total area of the surface, and they can be displayed for either internal or external insolation.
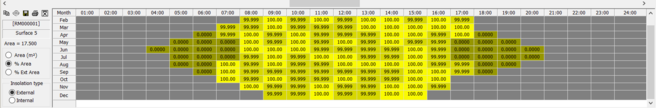
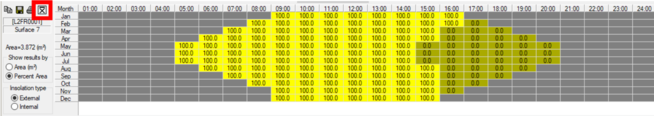
If the Percentage Area option is selected the grid shows the Area of Insolation as a percentage of the surface area:
In either format, if the area or percentage is zero, but the solar altitude is greater than zero, that cell of the grid will be shown in dark yellow, with a zero, to distinguish from the grey cells where the solar altitude is zero. Cells with a value between zero and the maximum value with shaded light grey.
External insolation is shown in yellow, whereas internal insolation is shown in cyan.
For sub-hourly simulation results are summed for each month / hour in the flexgrid.
The toolbar options have the following functions:
|
|
Copy the current grid to the clipboard. Choose to copy as text if you wish to paste into a spreadsheet, or as an image, to retain colours for reporting purposes.
|
|
|
Save the grid as a *.txt or *.csv format file, not as an image
|
|
|
Print the results.
|
|
|
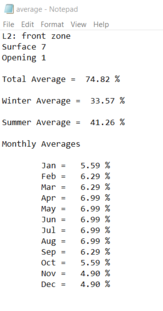
Text report of average % exposure for the selected surface are listed as a total average; summer average; winter average and monthly averages. Where a space is selected, the same data is listed for every surface and opening in the space.
|
To see the average values across a space in the model, after running the solar calculations, click on the average button  to the top left of the table when a space or opening has been selected.
This will then calculate the average across the space or opening, and present the results in a pop-up