10.2 Annual Probable Sunlit Hours
Sunlight studies measure access to the Sun, whereas daylight studies measure luminance and illuminance resulting from the Sun. Annual Probable Sunlit Hours (APSH) represents the sunlight that a given window may expect over a one-year period. APSH is expressed as the percentage of direct sunlight hours divided by the number of hours when the sky was clear with sun. APSH is measured on the outside face of the window. Two APSH metrics are used annual and winter months.
The BR209 method for APSH (BR 209 3.2.4) utilises manual diagrams for three UK locations and tests 100 points based on meteorological sunshine data, complied by the UK Met Office, to assess APSH. This source data includes the effect of cloud cover but has not been updated for many years or defined so that it cannot be replicated.
The meteorological term sunshine hours or sunshine duration is the source of this data and Sunshine duration is defined as direct solar radiation > 120 w/m2.
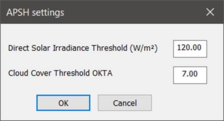
Tests using average weather files like TRY suggest that implementing APSH at high resolution (hourly) in the VE give results that are close to the original manual method. The closest match is achieved using filters of direct solar radiation > 120 w/m2 and Okta < 8. These default settings can be changed on the APSH settings dialog on the Options menu.
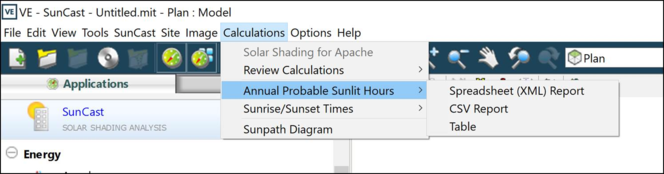
The Annual Probable Sunlight Hours (APSH) option is activated from the Calculations drop-down menu. The user needs to run Solar Shading for Apache first.
The results can be generated in either *.xml or *.csv format, which will automatically open in a spreadsheet, such as Excel, from where it can be copy/pasted.
This table shows every surface and opening, with unique identifiers and names, listing areas, orientation, and slope, followed by the APSH as monthly, annual, summer and winter values, followed by both annual and winter pass/fail results on the extreme right-hand columns.
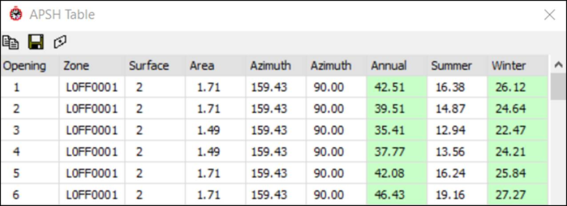
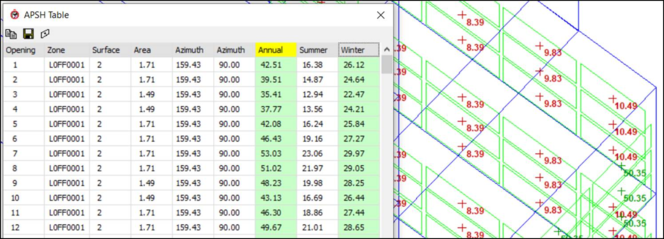
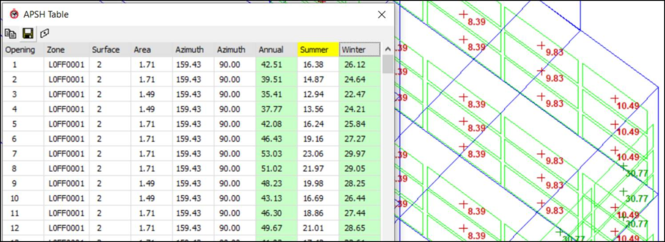
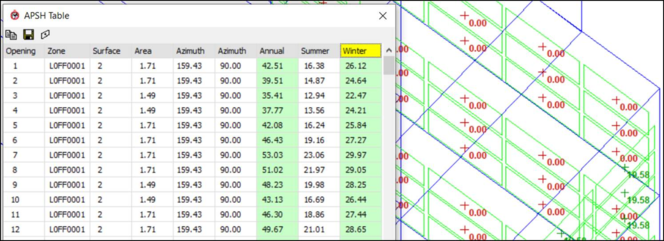
Selecting the Table option, pops-up a dialog showing the APSH results for the model; both annual and winter months APSH results are provided in the table and colour coded for BRE 209 compliance (annual > 25%; winter >= 5%).
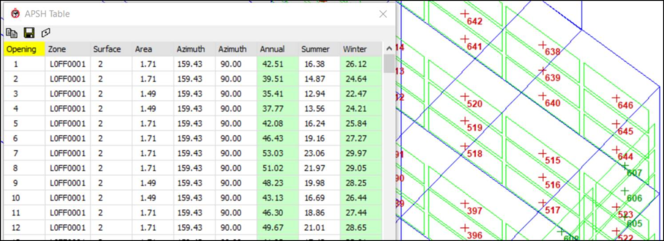
The  view button on the toolbar is a toggle to display the APSH results on the ViewPort -
Click the button once to see the window "indices" (this can help to identify the position of each window on the model to its opening number to check corresponding results on that row)
Click again to see the "Annual" results
Click again to see the "Summer" results
Click again to see the "Winter" results
click once more to switch the display OFF on the model, but the table will remain.
The font size displayed on the model can be increased using CTRL-"+" and decreased using CTRL-"-".