Variable Browser
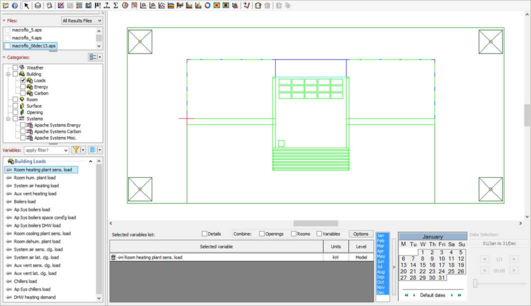
As of VE2014, a new ‘hybrid’ layout, which takes the best from Vista and old VistaPro layouts has been created. This should mean browsing for variables is even easier. As an overview, the new variable browser is undockable, resizable, and remembers exactly where you left it. You can collapse or resize the file and category controls to increase the amount of space for displaying variables. If that’s still not enough space, increase the width of the browser so the variable list becomes multi-column just like in Vista. The wider the browser the more columns you’ll see.
General
As you can see the new layout is somewhat different from the old one. It has been reorganized to provide a better top-down work flow. The variable tree has been split in two. The new tree only shows the available levels of data decomposition so that you can quickly show or hide the variables you are interested in. The variable list behaves much like the one in Vista with the added benefit of being able to expand/collapse individual levels and a few extra options using the new right-click menu. As mentioned previously the variable list is multi-column. When it is resized, it will automatically adjust to show as many columns as possible. Simply click and drag on the edge of the variable browser to resize the window.
The whole variable browser is dockable, allowing you to have it as a standalone window or fixed on whatever side of the model view you prefer. You can undock the browser using the gripper bar or undock button shown below.
Using the gripper bar, you can drag the browser to or from the left or right hand side of the view. When undocked you can double-click on the title bar to quickly dock the browser again. Alternatively, just drag the browser back into place. The browser remembers the last size and position of when it was docked and undocked, then restores itself when running the VE again or switching back into VistaPro view.
Sessions
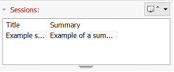
The sessions list shows you all your saved sessions. This allows you to retain your previous session by recalling the variables/rooms selected and recreates the charts generated. Different sessions can be added / removed / edited via the dropdown box

. If you need to see more files listed at once you can resize the list using the small gripper

located at the bottom of the control. The title and summary box allows you to give a detailed description of each session. Double clicking on each session automatically opens the data associated with that session.
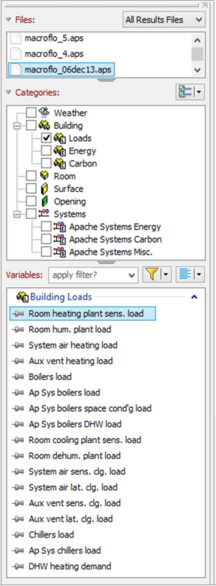
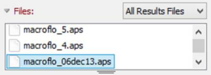
Files
The files list shows you all results files available for the current project. Selecting different options in the combobox will change what types of results files are displayed in the list. If you need to see more files listed at once you can resize the list using the small gripper

located at the bottom of the control. Once you’re done selecting files, you can collapse (or expand) the files section using the arrows


.
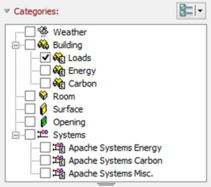
Categories
The category tree shows you all the available data levels for all files in the list. Use the tree to turn on the levels you want to see and populate the variables list. A right click menu also provides you with extra functionality. If you need to see more levels listed at once you can resize the tree using the small gripper
located at the bottom of the control. Once you’re done selecting levels, you can collapse (or expand) the categories section using the arrows
.
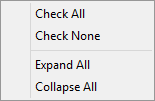
To the top right of the tree, there is the Presets button. With the button you can turn on or off all levels, as well as select, manage, or save user presets via the drop down.
Category Presets
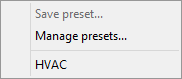
The presets drop down menu allows you to save the currently checked data levels as a preset or manage any presets you already have. Presets are global meaning they are not tied to a specified project.
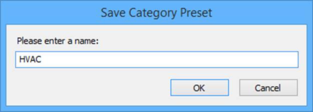
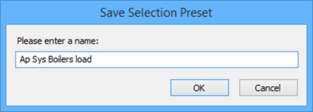
Upon saving a preset you will be prompted to enter a name. Once entered, the preset will show up in the drop down menu and can be used straight away. Note the save option will be disabled until you check more than one data level.
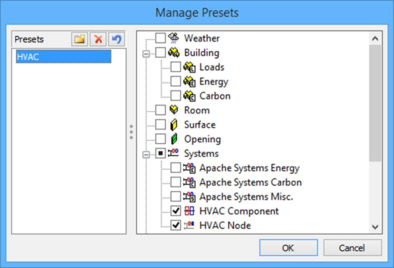
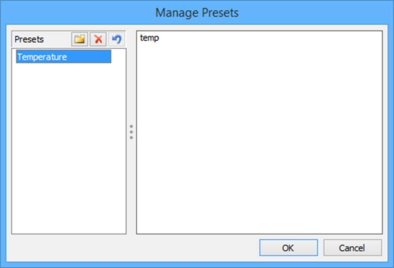
When managing presets, you will be presented with the dialog pictured above. Using the dialog you can create a new preset (

), as well as modify or delete (

) a current preset. You can also rename a preset by double clicking on it in the list. Any new or modified presets will show up as red in the list. If you want to undo any changes you have made to a preset you can use the revert button (

) to put it back to its original state.
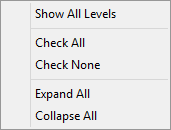
If you find all data levels aren’t shown for your preset, or you want to create a preset using levels that aren’t available to your current project, you can use the ‘Show All Levels’ option in the tree’s right click menu.
General Variables
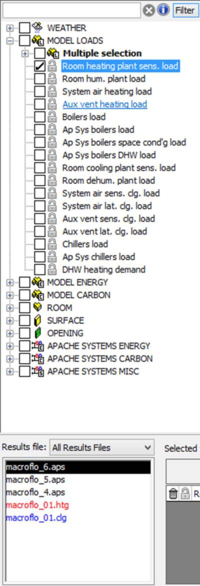
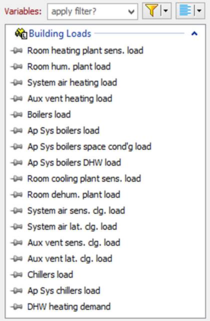
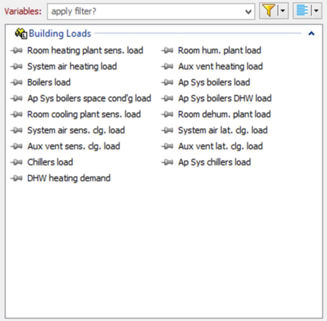
The variables list shows you all the available variables for the data levels you have selected. Use the list to select the variables you want to interrogate or visualise. Each data level can be collapsed (or expanded). Pinning an item stops it being removed from the list due to filtering or data level selection. A right click menu also provides you with extra functionality.
The variable list can be filtered using the edit box to the top of the list. Hover over the edit box to see how to use filters. Type a query, then hit enter (or press the Filter button) to filter the list of variables. The Filter button also allows you to select, manage, or save user presets via the drop down. Once you have entered a filter you can clear it using the X button as pictured above. The last 10 queries entered are shown in the drop down list.
To the top right of the tree, there is the Selections Presets button. With the button you can select or deselect all variables, as well as select, manage, or save user presets via the drop down.
Filter Presets
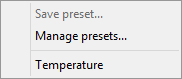
The presets drop down menu allows you to save the currently applied filter as a preset or manage any presets you already have. Presets are global meaning they are not tied to a specified project.
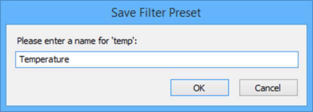
Upon saving a preset you will be prompted to enter a name. Once entered, the preset will show up in the drop down menu and can be used straight away.
When managing presets, you will be presented with the dialog pictured above. Using the dialog you can create a new preset (
), as well as modify or delete (
) a current preset. You can also rename a preset by double clicking on it in the list. Any new or modified presets will show up as red in the list. If you want to undo any changes you have made to a preset you can use the revert button (
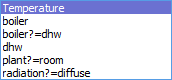
) to put it back to its original state. Note multi-query inputs (i.e. using ‘?’), will show up in the preset dialog on separate lines.
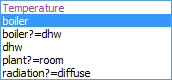
When you use a filter preset the name of the preset will show up in the filter edit box / most recent list in purple to signify the difference between a normal query.
Selection Presets
The presets drop down menu allows you to save the currently selected variables as a preset or manage any presets you already have. Presets are global meaning they are not tied to a specified project.
Upon saving a preset you will be prompted to enter a name. Once entered, the preset will show up in the drop down menu and can be used straight away.
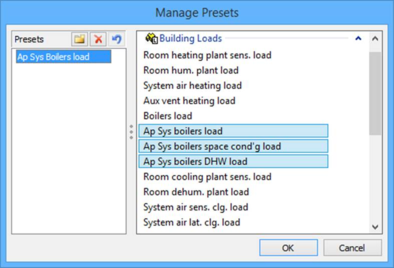
When managing presets, you will be presented with the dialog pictured above. Using the dialog you can create a new preset (
), as well as modify or delete (
) a current preset. You can also rename a preset by double clicking on it in the list. Any new or modified presets will show up as red in the list. If you want to undo any changes you have made to a preset you can use the revert button (
) to put it back to its original state.
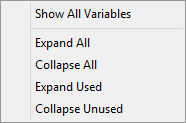
If you find all variables aren’t shown for your preset, or you want to create a preset using variables that aren’t available to your current project, you can use the ‘Show All Variables’ option in the tree’s right click menu.
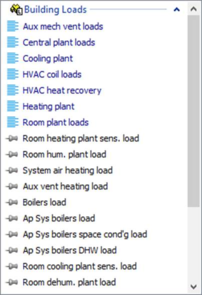
The old VE ‘Multiple selection’ presets are now accessed via the Selection Presets drop down menu. If you find this is a bit out of the way, you can display the selection presets in the variables list by turning on the ‘Show presets in list’ option. This will display the presets at the top of each data level in the list as pictured above. The option you choose persists between different VE runs.
Energy Breakdown Variables
With the addition of

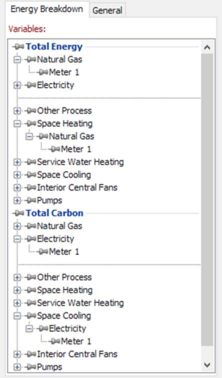
Energy Meters to Apache in VE2017 it is now possible to see a breakdown of your Building’s Energy and Carbon usage in VistaPro. The new Energy Breakdown tree allows you to view aggregated results for the Total Energy/Carbon used, each Energy Source and Energy Use, as well as individual Energy Meter results recorded during simulation.
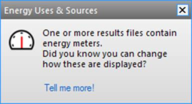
When a project (old or new) is found to contain energy meter results you will see the alert above notifying you of the fact the energy breakdown feature is available. Dismissing the alert (by closing it or clicking on the link) will stop it from showing the next time you open the project in the VE. Once you have dismissed 5 alerts you will no longer be notified of the new energy breakdown feature for any project.
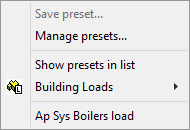
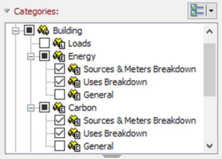
Energy Breakdown variables are not visible by default and can be turned on using the Categories tree. The options to view the Sources & Meters Breakdown and the Uses Breakdown are located under the Building Energy and Building Carbon categories. If the project you have opened doesn’t contain any meter results, these options will be disabled. All other variables not related to sources, uses and meters will appear in the General variable list as before.
There are 6 distinct types of Energy Breakdown variable which make up the tree. Each type is a different level of aggregation in the tree. The types are as follows:
|
Total
|
The total energy consumed / carbon produced by the entire building.
|
|
├─ Source
|
The total energy consumed / carbon produced by the specified source.
|
|
│ └─ Source by Meter
|
The total energy consumed / carbon produced by the specified source and meter.
|
|
└─ Use
|
The total energy consumed / carbon produced by the specified use.
|
|
└─ Use by Source
|
The total energy consumed / carbon produced by the specified use and source.
|
|
└─ Use by Source and Meter
|
The total energy consumed / carbon produced by the specified use, source and meter.
|
Each node in the tree feeds into the one above, therefore a parent node is the accumulation of all its children. The only exception to this rule is the Total Energy/Carbon nodes as the sum of all the Sources equals the sum of all the Uses. The breakdowns are just different ways of accumulating the same data. This fact is represented by the dotted/dashed line on the tree. A more concise way of thinking about it is in the form of an energy matrix like below.
|
|
Source A
|
Source B
|
|
Total
|
|
Meter a
|
Meter b
|
Meter c
|
Meter d
|
|
|
Use 1
|
x
|
x
|
|
x
|
|
x
|
x
|
x
|
x
|
|
|
Use 2
|
x
|
x
|
|
x
|
|
x
|
x
|
x
|
x
|
|
|
|
|
|
|
|
|
|
|
Total
|
x
|
x
|
x
|
x
|
|
x
|
|
x
|
x
|
|
Alternative (pivoted) view
|
|
Use 1
|
Use 2
|
|
Total
|
|
Source A
|
x
|
x
|
|
x
|
|
├ Meter a
|
x
|
x
|
|
x
|
|
└ Meter b
|
x
|
x
|
|
x
|
|
Source B
|
x
|
x
|
|
x
|
|
├ Meter c
|
x
|
x
|
|
x
|
|
└ Meter d
|
x
|
x
|
|
x
|
|
|
|
|
|
|
|
Total
|
x
|
x
|
|
x
|
Here each coloured ‘x’ cell in the matrix refers to one of the different breakdown types mentioned above.
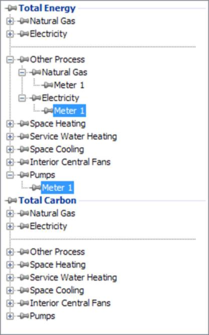
Certain Energy Uses have a tied Energy Source, which in other words means they have a single fixed source of energy. For example, Pumps are always powered by Electricity. Any Uses which are tied to a Source will have the Source name omitted from the Energy Breakdown tree and variables. See below for an example.
Lastly, it is important to note that only variables which are visible and selected on the tree will appear in the variable list. That is to say, if a child node is selected and the parent node is then collapsed so the child is no longer visible, the child variable will be removed from the selected variables list. The tree however remembers the selection, so when the parent node is expanded again, the child variable will be readded to the list. Any variables which are pinned in the tree also stop their parent nodes from being collapsed.
Please note that Energy Breakdown variables are currently not supported by the Filter Preset, Selection Preset and Custom Variable features.
Analysis Toolbar
Below is a brief description of each button on the analysis toolbar.
Note: some features are described in more detail elsewhere in this document.
|
|
Open a results file
|
Allows you to add a results file to the list of files to interrogate. This is useful for when you have results files out with the project’s vista folder.
|
|
|
Results file properties
|
Provides you with a report summarising what data has been recorded in the selected results file.
|
|
|
Select object
|
Enabling this allows you to select objects within the model view.
|
|
|
Layer Properties
|
Brings up the layers dialog which allows you to modify the name and colour of each individual layer as well as what ones are visible.
|
|
|
Heating and cooling report
|
Generates a heating and cooling report based on the selected results file. This allows you to view building energy, CO2, comfort and other relevant information at a glance.
|
|
|
Tariff Analysis
|
Allows you to performance tariff analysis for costing the running of you building based on the selected results file.
|
|
|
Graph
|
Displays a straightforward plot of the currently selected data as a graph.
|
|
|
Multiple-room graph plotter
|
Allows you to automatically plot several rooms and output each graph to disk.
|
|
|
Table
|
Displays a data table of values for the currently selected data.
|
|
|
Snapshot
|
Shows the value of any selected variable for the date/time specified as a data table.
|
|
|
Synopsis (min/mean/max)
|
Displays a data table for the selected data in terms of minimum, mean and maximum values, over the currently selected time period.
|
|
|
Range tests
|
Allows you to test for certain conditions being met and how frequently specified limits are exceeded.
|
|
|
Monthly totals
|
Displays as a table the total of all data values over a calendar month.
|
|
|
Peak time table
|
Shows the peak date time and value of the selected variable(s) in a table.
|
|
|
Peak day table
|
Similar to above, except that it shows all the values for the peak day.
|
|
|
Peak day graph
|
Shows you the peak day results as a graph.
|
|
|
Peak day graph (Auto save)
|
Same as above, but also saves the chart to disk under the project’s Vista/Graphs folder.
|
|
|
XY Plot
|
Similar to the normal plot but uses the new charting tool which allows you to perform highlighting/analysis.
|
|
|
XY stacked plot
|
Displays a graph plot using the new charting tool where all variables with the same units are merged together.
|
|
|
Bar stack (+/-)
|
Similar to the stacked plot but displays monthly/daily totals as a bar chart. Allows items to be display below the x-axis; this is typically used for heat gains / heat losses, heating / cooling loads etc.
|
|
|
Bar stack (absolute)
|
Similar to the bar stack above however all items are above the x-axis; i.e. there’s no negative values.
|
|
|
Bar side by side
|
Allows you to compare several files as a side-by-side bar chart.
|
|
|
Donut chart
|
A donut chart which combines all variables with the same units in one visual display for fractional contribution analysis.
|
|
|
Colour Gradient
|
A colour coded data table which displays the selected results in compact form.
|
|
|
Value Gradient
|
Similar to above but displays a more detailed table with the actual values preset.
|
|
|
3D Graph
|
Displays the selected variables as a 3D graph for the specified date/time range.
|
|
|
Comfort settings
|
Brings up the Comfort dialog which allows you to define the parameters used in comfort analysis.
|
|
|
MacroFlo arrows
|
Allows you to visualise airflow results obtained from Apache MacroFlo calculations on each opening in your model.
|
|
|
Variable colour scale
|
Allows you to visualise room level results on your model by applying a colour scale.
|
|
|
Visual Analysis (Model Viewer II)
|
Similar to the old viewer feature above but displayed using Model Viewer II.
|
|
|
MacroFlo Arrows (Model Viewer II)
|
Similar to the old viewer feature above but displayed using Model Viewer II.
|
|
|
Find node
|
Allows you find an HVAC node by its number. Useful for when you have a large HVAC network to look through.
|
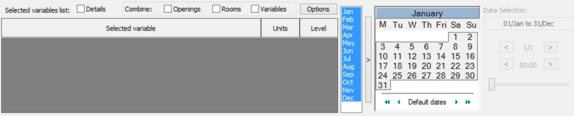
‘Vista Bar’
The ‘Vista Bar’ allows you change how selected variables are displayed / combined as well as the date/time you wish to interrogate. More details below.
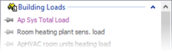
Selected Variables List
The selected variables list displays all variables you have selected in the variables browser.
These variables are the ones which will be used for charting/plotting and visual analysis display.
Selecting the ‘Details’ option allows you to see and modify parameters used for analysis.
Limits (shading):
Refer to the lower and upper limits used to generate the colours applied to your model.
Division:
Allows you divide room level variable results by area or volume.
Combine Options
The combine functionality allows to you to combine multiple variables in certain ways.
Openings:
This option allows you to combine all opening results in the same surface to provide a single output for each selected variable(s).
Rooms:
This option allows you to combine all room level variable results to provide a single output for all the selected rooms.
Note: If your room browser is in a grouping scheme mode, for example ‘Floors’ or ‘Types’, then results will be combined by all selected rooms in each room group.
Variables:
This option allows you to combine variable results that have the same units.
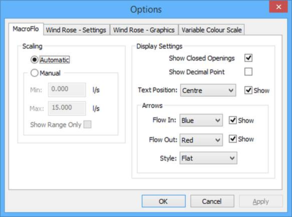
Display Options
The ‘Options’ button brings up the display options dialog which allows you to modify/customize the way the visual analysis features in Model Viewer I & II work.
MacroFlo
These options control the way MacroFlo arrows are displayed in Model Viewer I.
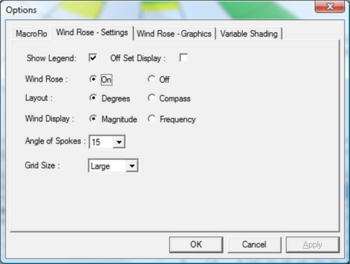
Wind Rose – Settings
These options control the way Wind Rose are displayed in Model Viewer I.
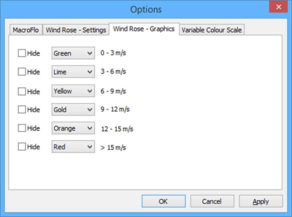
Wind Rose – Graphics
These options control the way Wind Rose are displayed in Model Viewer I.
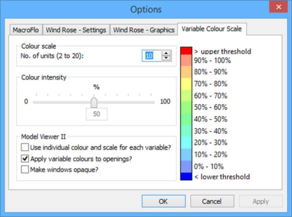
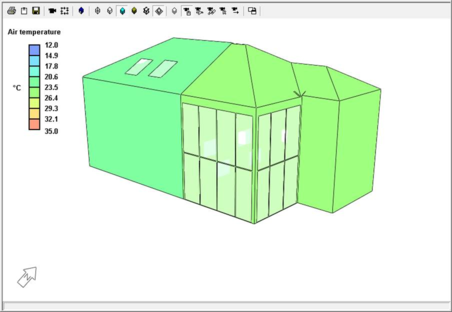
Variable Colour Scale
These options control the way variable shading works in Model Viewer I & II.
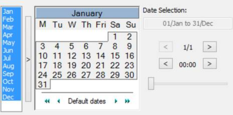
Date / Time Selection
This allows you to select the date range used in charting/plotting as well as the individual time step used in visual analysis. You can select a date range using the months list or the calendar. A time step can be selected using the next/previous day/time buttons as well as the slider which can be used to easily go through the entire selected date range.
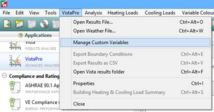
Custom Variables
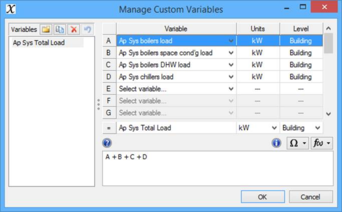
This new feature allows you to create custom ‘post-process’ variables using the standard set of variables output in Apache results files. Custom variables are just other variables combined in some form to produce another output. They are generic meaning they are not linked to any specific rooms, surfaces, openings, system, component or HVAC object. This allows you to create variables that can be used across multiple projects.
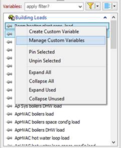
Managing your custom variables can be done in two ways; through the VistaPro menu, or via the variable list right-click menu.
When managing variables, you will be presented with the dialog pictured above. Using the dialog you can create a new variable (
), as well as modify or delete (
) a current variable. You can also rename a variable by double clicking on it in the list. Any new or modified variables will show up as red in the list. If you want to undo any changes you have made to a variable you can use the revert button (
) to put it back to its original state. You can also create a new variable based on another one using the copy button (

).
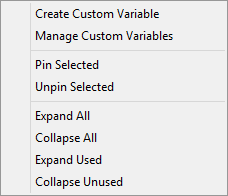
Another way to create a new variable is to select one or more variables in the list, right-click and select the ‘Create Custom Variable’ option. This will bring up the Manage Custom Variables dialog prefilled with your selected variables, an expression similar to ‘A + B …’, and a name.
Once you have created a new custom variable, it will show up in the variable list as purple .
Note: If you press Alt + LMB to select the custom variable it will additionally select all of its input variables and clear any previous selections made.
|
Valid Combinations
↓What / With→
|
Weather
|
Utility1
|
Building
|
Room
|
Surface
|
Opening
|
Apache System
|
HVAC Comp.
|
HVAC Node
|
Process
|
Component
|
|
Weather
|
●
|
|
●
|
●
|
●
|
●
|
●
|
●
|
●
|
●
|
●
|
|
Utility1
|
|
●
|
●
|
|
|
|
|
|
|
|
|
|
Building
|
●
|
●
|
●
|
●
|
●
|
●
|
|
|
|
|
|
|
Room
|
●
|
|
●
|
●
|
●
|
●
|
|
|
|
|
|
|
Surface
|
●
|
|
●
|
●
|
●
|
●
|
|
|
|
|
|
|
Opening
|
●
|
|
●
|
●
|
●
|
●
|
|
|
|
|
|
|
Apache System
|
●
|
|
|
|
|
|
●
|
|
|
|
|
|
HVAC Comp.
|
●
|
|
|
|
|
|
|
●
|
●
|
|
|
|
HVAC Node
|
●
|
|
|
|
|
|
|
●
|
●
|
|
|
|
Process
|
●
|
|
|
|
|
|
|
|
|
●
|
|
|
Component
|
●
|
|
|
|
|
|
|
|
|
|
●
|
1 – from Utility files (*.apu)
Although custom variables are generic, there are still some rules/restraints imposed.
· Only certain levels of decomposition can be combined. See the matrix above.
· Custom variables can reference other custom variables as input.
· A maximum of 26 input variables (i.e. A to Z) can be used.
· If all input variables have the same unit type, the default output unit type will be the same. If they are different the output unit type will default to ‘Number’. This can be changed at any time using the dropdown list. Note: Any unit types can be combined, so it is up to you (the user) to produce a sensible output variable and corresponding unit type.
· The lowest level of decomposition determines what level of decomposition your output variable will be. For example, a variable which includes Weather, Building, and Room variables will be a Room level output.
· If the output level of decomposition has sub levels (i.e. Loads, Energy, Carbon, Misc.) you can specify the actual level using the dropdown.
· Only HVAC Component variables of the same component type can be combined.
· The Combine options (Rooms, Variables, Openings) in VistaPro are not supported.
· Input variables must be from the same file. Referencing variables from different files will not produce any output. The only exception to this rule is Utility level variables, found in Utility files (*.apu), which can be used with Building level variables.
· A custom variable will only show up in the variable browser if all input variables are available.
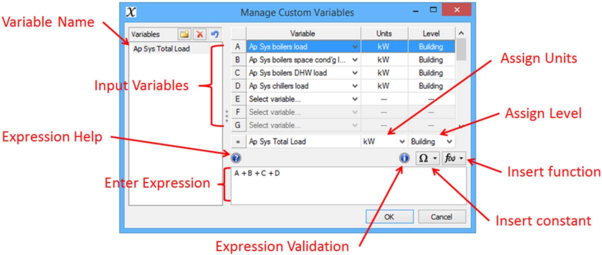
Below is a diagram detailing the various elements of the Manage Custom variables dialog.
As you can see there are various elements attributed to entering your mathematical expression. Upon entering your expression, the validation icon will change to indicate whether everything is ok, or there are some errors within your expression.
Here’s a quick overview of how to enter expressions.
· Reference your input variables by using the assigned letter (A to Z).
· Combine variables using operators or functions.
o Arithmetic and relational operators are supported.
o Numerical and logical functions are supported.
· You can input constants (PI, NAN, etc.), model constants (e.g. Room Area/Volume), or even just enter numbers directly.
It’s worth noting when entering expressions / plotting custom variables, the entire dataset for each input variable is used and not just the values for the selected date range. This means you may not see the outputs you would expect. For more detailed information on expressions click
here .
Visualisation
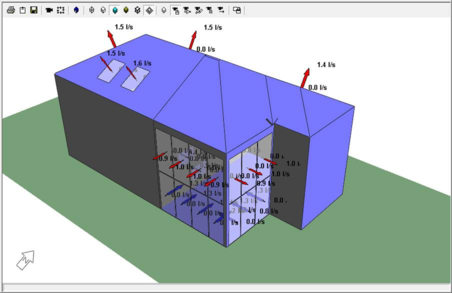
MacroFlo Arrows
Airflow results obtained from MacroFlo calculations are now visualised with arrows and values on each opening.
Variable Shading
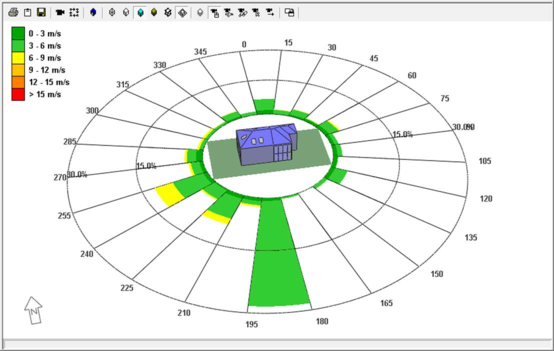
Wind Rose
A visual representation of the main wind directions for the chosen location. View settings for the wind rose can be adjusted in Options dialog.