|
|||||
|
|
|||||
|
|
VE 2017
|
ApacheHVAC User Guide Part F: Loads Analysis and Reporting Tools
|
37
|

|
Apache
|
|
|
|
|
|
|
|
Data
|
Description
|
|
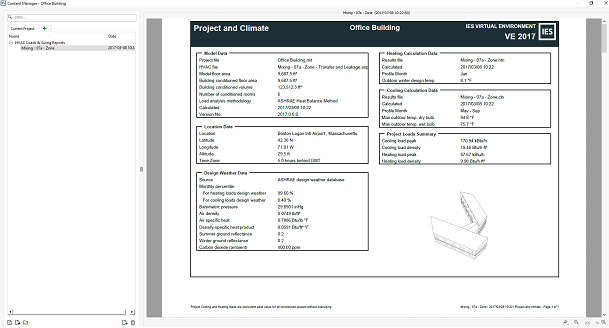
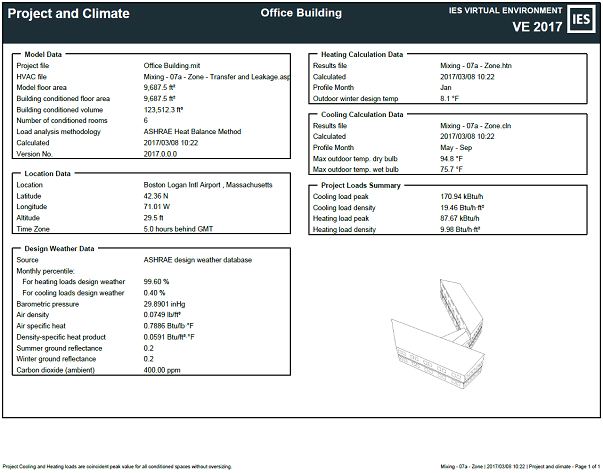
Project file
|
The project .mit file name
|
|
HVAC file
|
The project .asp file used to generate the report
|
|
Model floor area
|
Total building floor area
|
|
Building floor area
|
Building conditioned floor area
|
|
Building Volume
|
Building conditioned volume
|
|
Number of conditioned rooms
|
Total number of rooms served by a system
|
|
Load analysis methodology
|
ASHRAE Heat Balance Method as per Apache Loads
|
|
Calculated
|
Date and time of calculation
|
|
Version No.
|
IESVE Version Number
|
|
Location Data:
The location data frame contains the following information:
Data
|
Description
|
|
Location
|
Taken from the ‘location & Site Data’ tab in ApLocate
|
|
Latitude
|
Taken from the ‘location & Site Data’ tab in ApLocate
|
|
Longitude
|
Taken from the ‘location & Site Data’ tab in ApLocate
|
|
Altitude
|
Taken from the ‘location & Site Data’ tab in ApLocate
|
|
Time Zone
|
Taken from the ‘location & Site Data’ tab in ApLocate
|
|
Design Weather Data:
The design weather data frame contains the following information:
Data
|
Description
|
|
Source
|
Taken from the ‘Design Weather Data’ tab in ApLocate
|
|
Monthly percentile - heating
|
Taken from the ‘Design Weather Data’ tab in ApLocate
|
|
Monthly percentile - cooling
|
Taken from the ‘Design Weather Data’ tab in ApLocate
|
|
Barometric pressure
|
This is atmospheric pressure taken from the design weather data
|
|
Air density
|
Taken from the ‘location & Site Data’ tab in ApLocate. This is either:
· Standard value which is the same for all locations (default)
· Custom value which can be entered by the user
· Derived value. Here the user can enter elevation and reference dry bulb and relative humidity values to derive the air density
|
|
Air specific heat
|
Constant value of 1019J/kgK in SI and 0.7886 Btu/lb·°F in IP
|
|
Density-spec heat product
|
Product of air density and specific heat
|
|
Summer Ground reflectance
|
Taken from the ‘location & Site Data’ tab in ApLocate
|
|
Winter Ground reflectance
|
Taken from the ‘location & Site Data’ tab in ApLocate
|
|
Carbon dioxide (ambient)
|
Taken from the ‘location & Site Data’ tab in ApLocate
|
|
Heating Calculation Data:
The heating calculation data frame contains the following information:
Data
|
Description
|
|
Results file
|
Name of associated .htn file
|
|
Calculated
|
Date and time of calculation
|
|
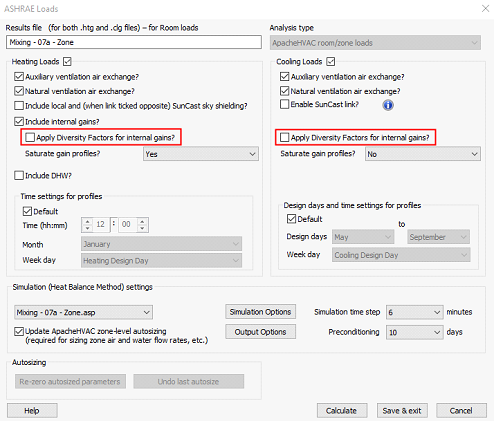
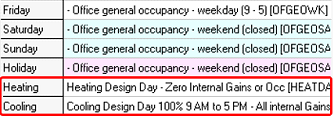
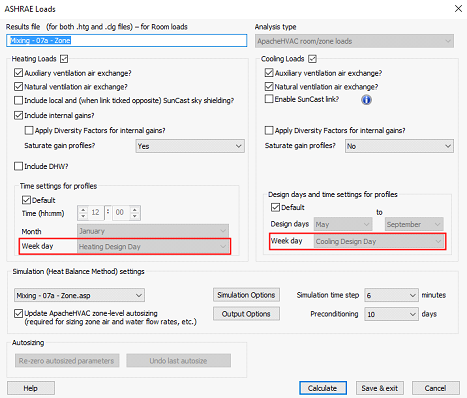
Profile Month
|
Taken from Apache System Loads settings
|
|
Outdoor winter design temp
|
Taken from the ‘Design Weather Data’ tab in ApLocate
|
|
Cooling Calculation Data:
The cooling calculation data frame contains the following information:
Data
|
Description
|
|
Results file
|
Name of associated .cln file
|
|
Calculated
|
Date and time of calculation
|
|
Profile Month
|
Taken from Apache System Loads settings
|
|
Max. outdoor temp dry bulb
|
Taken from the ‘Design Weather Data’ tab in ApLocate
|
|
Max. outdoor temp wet bulb
|
Taken from the ‘Design Weather Data’ tab in ApLocate
|
|
Project Loads Summary Data:
The project loads summary data frame contains the following information:
Data
|
Description
|
|
Cooling loads peak
|
This is the cooling design load peak taken from the System Parameters dialog for all active systems and summed to give the project cooling load peak. Note that this may potentially be a non-coincident peak if the systems are loaded at differing times.
|
|
Cooling load density
|
This is the cooling design load density associated with the peak shown above
|
|
Heating loads peak
|
This is the heating design load peak taken from the System Parameters dialog for all active systems and summed to give the project heating load peak. Note that this may potentially be a non-coincident peak if the systems are loaded at differing times.
|
|
Heating load density
|
This is the heating design load density associated with the peak shown above.
|
|
Data
|
Description
|
|
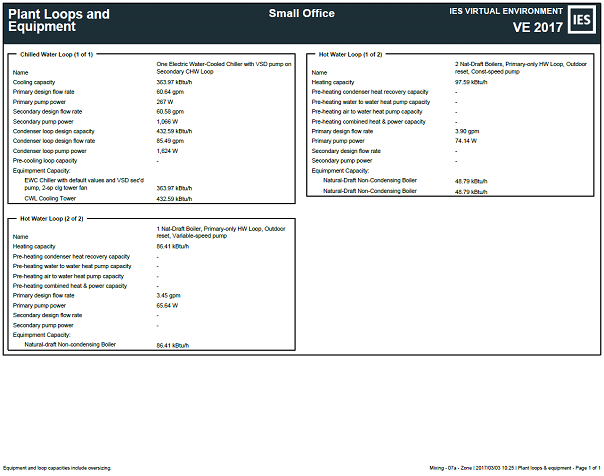
Name
|
Chilled water loop reference name from the .asp file
|
|
Cooling capacity
|
Chilled water loop capacity from the .asp file
|
|
Primary design flow rate
|
Chilled water loop primary flow rate from the .asp file
|
|
Primary pump power
|
Chilled water loop primary flow rate multiplied by the relevant specific pump power, both from the .asp file
|
|
Secondary design flow rate
|
Here the capacity for each coil on the secondary loop is summed and the flowrate is calculated using the loop temperature difference
|
|
Secondary pump power
|
This is the flow rate calculated above multiplied by the relevant specific pump power
|
|
Condenser loop design capacity
|
Condenser water loop heat rejection capacity taken from the .asp file
|
|
Condenser loop design flow rate
|
Condenser water loop flow rate taken from the .asp file
|
|
Condenser loop pump power
|
Condenser water loop flow rate multiplied by condenser water loop specific pump power both taken from the .asp file
|
|
Pre-cooling loop capacity
|
Chilled water loop pre-cooling capacity taken from the .asp file
|
|
Equipment name and capacities - Chiller
|
Taken from the .asp file for each chiller:
Name: Reference name from the .asp file
Capacity: Design condition cooling capacity, Qdes
|
|
Equipment name and capacities – Cooling Tower
|
Taken from the .asp file
Name: Cooling tower (set label)
Capacity: Heat rejection, Qhrdes
|
|
Equipment name and capacities – Fluid cooler
|
Taken from the .asp file
Name: Fluid Cooler (set label)
Capacity: Heat rejection, Qhrdes
|
|
Hot Water Loop:
The hot water loop frame contains the following information:
Data
|
Description
|
|
Name
|
Hot water loop reference name from the .asp file
|
|
Heating capacity
|
Hot water loop capacity from the .asp file
|
|
Pre-heating condenser heat recovery capacity
|
Combination of two parameters - source multiplied by max heat recovery with HX. Source is the design capacity of either a specified part load chiller or condenser water loop. The HX parameters taken from the heat recovery dialog. Note if the user chooses an explicit heat transfer model, the calculation is source multiplied by heat exchanger design effectiveness. All parameters taken from the .asp file
|
|
Pre-heating water to water heat pump Capacity
|
As above but the calculation is extended due to the heat pump capacity rating i.e. Source multiplied by max. heat recovery with HX multiplied by heat pump capacity.
In the case of explicit heat transfer model the calculation is: Source multiplied by heat exchanger design effectiveness X heat pump capacity as a percentage of source loop capacity. All parameters taken from the .asp file
|
|
Pre-heating air to water heat pump capacity
|
Combination of two parameters - referenced air-to-water heat pump dialog output multiplied by the percent of auto sized heat source capacity. All parameters taken from the .asp file
|
|
Pre-heating combined heat & power capacity
|
This parameter comes from heat output in the CHP generator dialog
|
|
Primary design flow rate
|
Hot water loop primary flow rate from the .asp file
|
|
Primary pump power
|
Combination of two parameters - Hot water loop primary flow rate multiplied by the relevant specific pump power, both from the .asp file
|
|
Secondary design flow rate
|
Here the capacity for each coil on the secondary loop is summed and the flowrate is calculated using the loop temperature difference. Thus is then summed for all secondary loops
|
|
Secondary pump power
|
Combination of two parameters - Hot water loop secondary flow rate multiplied by the relevant specific pump power summed for all secondary loops
|
|
Equipment name and capacities - Boilers
|
Taken from the .asp file for each boiler:
Name: Reference name from the .asp file
Capacity: Design condition heating capacity, Qdes
|
|
Heat Transfer Loop:
The heat transfer loop frame contains the following information:
Data
|
Description
|
|
Name
|
Heat transfer loop reference name from the .asp file
|
|
Heating capacity
|
Heat transfer loop heating capacity from the .asp file
|
|
Cooling capacity
|
Heat transfer loop cooling capacity from the .asp file
|
|
Design flow rate
|
Heat transfer loop flowrate from the .asp file
|
|
Primary pump power
|
Combination of two parameters - flow rate multiplied by primary circuit specific pump power. All parameters taken from the .asp file
|
|
Secondary pump power
|
Combination of two parameters - flow rate multiplied by secondary circuit specific pump power. All parameters taken from the .asp file
|
|
Heat acquisition - condenser heat recovery capacity
|
As per condenser heat recovery for hot water loops
|
|
Heat acquisition – water to water heat pump capacity
|
As per WWHP for hot water loops
|
|
Heat acquisition – air to water heat pump capacity
|
As per AWHP for hot water loops
|
|
Heat acquisition – combined heat & power thermal capacity
|
As per CHP for hot water loops
|
|
Water-source heat exchanger - heating capacity
|
Heat transfer loop water-source heat exchanger heating capacity from the .asp file
|
|
Water-source heat exchanger - cooling capacity
|
Heat transfer loop water-source heat exchanger heating capacity from the .asp file
|
|
Heating equipment capacity - Boilers
|
Taken from the .asp file for each boiler:
Name: Reference name from the .asp file
Capacity: Design condition heating capacity, Qdes
|
|
Heat rejection equipment capacity – Cooling tower
|
Taken from the .asp file
Name: Cooling tower (set label)
Capacity: Heat rejection, Qhrdes
|
|
Heat rejection equipment capacity – Fluid cooler
|
Taken from the .asp file
Name: Fluid Cooler (set label)
Capacity: Heat rejection, Qhrdes
|
|
Data
|
Description
|
|
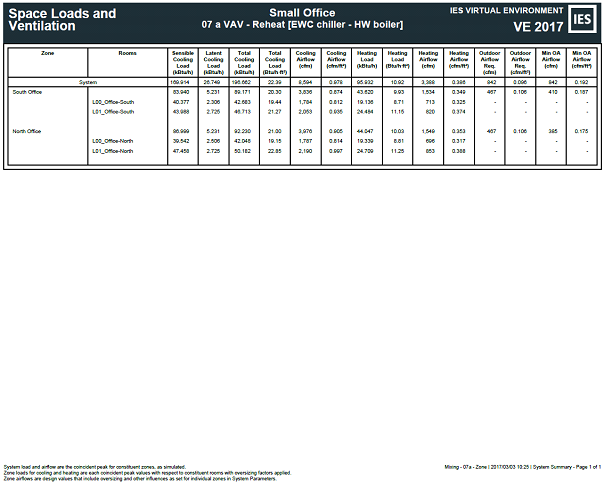
Sensible Cooling Load
|
Coincident peak value from the System Loads run for all zones on the system
|
|
Latent Cooling Load
|
Coincident peak value from the System Loads run for all zones on the system
|
|
Total Cooling load (also provided per unit floor area)
|
Sum of the above
|
|
Cooling Airflow (also provided per unit floor area)
|
The system airflow peak from the System Loads run at the time of peak cooling load
|
|
Heating load (also provided per unit floor area)
|
Coincident peak value from the System Loads run for all zones on the system
|
|
Heating Airflow (also provided per unit floor area)
|
The system airflow peak from the System Loads run at the time of peak heating load
|
|
Outdoor Airflow Req. (also provided per unit floor area)
|
This is system minimum outdoor ventilation requirement before considering the possibility of a greater requirement for outside air to make up for total system exhaust airflow and is equivalent to Vot in the System Parameters UI
|
|
Min OA Airflow (also provided per unit floor area)
|
Minimum outdoor air from the System Loads run at cooling vs. heating peak times
|
|
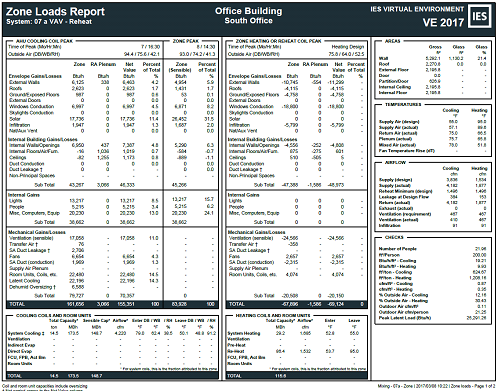
Zone Level:
The following information is provided for each zone served by the system:
Data
|
Notes
|
|
Sensible Cooling Load
|
Coincident peak value from the Room & Zone Loads run for all rooms in the zone
|
|
Latent Cooling Load
|
Coincident peak value from the Room & Zone Loads run for all rooms in the zone
|
|
Total Cooling load (also provided per unit floor area)
|
Sum of the above
|
|
Cooling Airflow (also provided per unit floor area)
|
The Zone Cooling Max Airflow from the System Parameters UI
|
|
Heating load (also provided per unit floor area)
|
Coincident peak value from the Room & Zone Loads run for all rooms in the zone
|
|
Heating Airflow (also provided per unit floor area)
|
The Zone Heating Max Airflow from the System Parameters UI
|
|
Outdoor Airflow Req. (also provided per unit floor area)
|
Zone Ventilation Max/Total Required from the System Parameters UI
|
|
Min OA Airflow (also provided per unit floor area)
|
Minimum outdoor air from the System Loads run at cooling vs. heating peak times
|
|
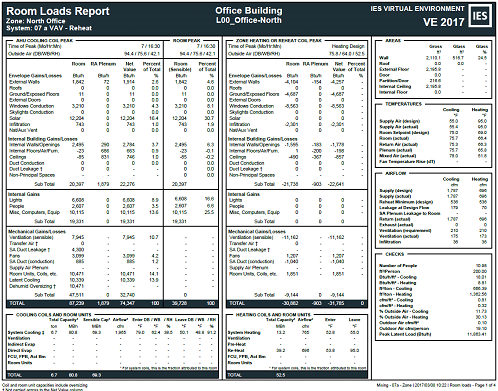
Room Level:
The following information is provided for each room served by the system:
Data
|
Notes
|
|
Sensible Cooling Load
|
Peak value from the Room & Zone Loads run for the room
|
|
Latent Cooling Load
|
Peak value from the Room & Zone Loads run for the room
|
|
Total Cooling load (also provided per unit floor area)
|
Sum of the above
|
|
Cooling Airflow (also provided per unit floor area)
|
The Zone Cooling Max Airflow from the System Parameters UI multiplied by the room airflow apportioning factor (%) as per the Zone Airflow Distribution table.
|
|
Heating load (also provided per unit floor area)
|
Peak value from the Room & Zone Loads run for the room
|
|
Heating Airflow (also provided per unit floor area)
|
The Zone Heating Max Airflow from the System Parameters UI multiplied by the room airflow apportioning factor (%) as per the Zone Airflow Distribution table
|
|
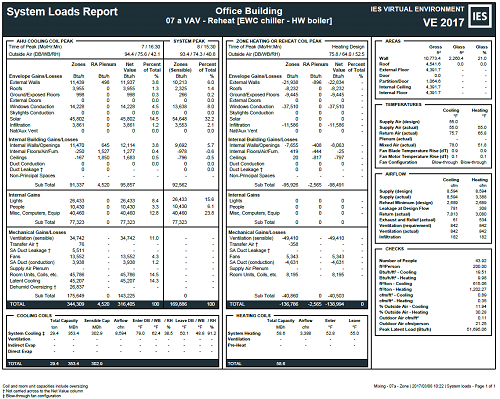
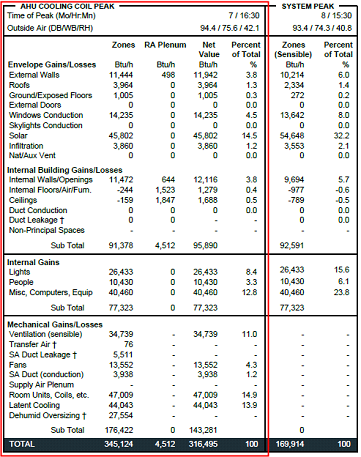
Data
|
Notes
|
|
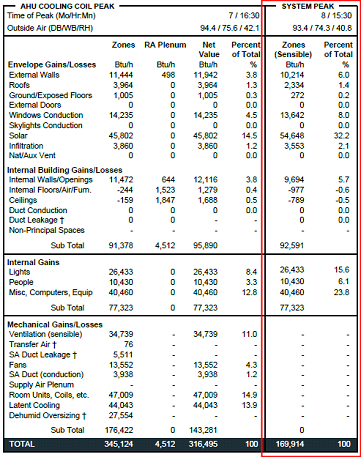
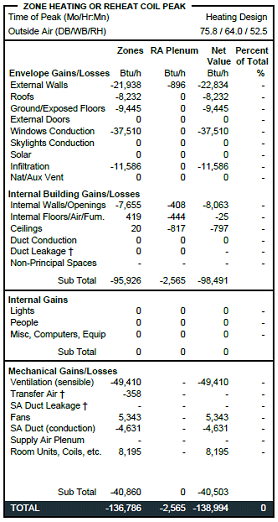
External Walls
|
Conduction gain - external wall from the .cln file
|
|
Roofs
|
Conduction gain – roof from the .cln file
|
|
Ground/Exposed Floors
|
Conduction gain - ground floor from the .cln file
|
|
External Doors
|
Conduction gain – external doors from the .cln file
|
|
Windows Conduction
|
Conduction gain - external glazing from the .cln file
|
|
Skylight Conduction
|
Conduction gain – rooflights from the .cln file
|
|
Solar
|
Solar gain from the .cln file
|
|
Infiltration
|
Infiltration gain from the .cln file
|
|
Nat/Aux Vent
|
Natural vent gain + Aux mech vent gain from the .cln file
|
|
Internal Building Gains/Losses:
Data
|
Notes
|
|
Internal Walls/ Openings
|
Conduction gain - internal wall + Conduction gain - internal door + Conduction gain - internal glazed from the .cln file
|
|
Internal Floors/Air/Furn.
|
Conduction gain – floor + Air & furniture dynamic gain from the .cln file
|
|
Ceilings
|
Conduction gain – ceiling from the .cln file
|
|
Duct Conduction
|
Duct conduction gain from the .cln file. This contributes to the Net Total column. If the duct is contained within the same control volume (i.e., within the subject conditioned space), the space gain will be cancelled by an equal loss reported on the SA Duct (conduction) line in mechanical gains/losses
|
|
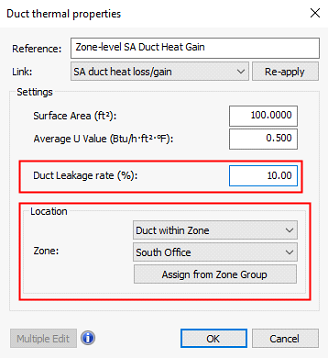
Duct Leakage†
|
Duct leakage sensible gain from the .cln file. This reports the gain to subject space in Room/Zone column and gain to RA Plenum serving the subject space in the RA Plenum column where appropriate depending on the leakage configuration in the HVAC file.
As designated by the dagger, duct Leakage gain does not contribute to the Net Value column because it is either internal to the control volume or already included in the ventilation gain terms.
Note: not to be confused with ‘SA Duct Leakage’ in Mechanical Gains/Losses section.
|
|
Non-Principal Spaces
|
This is the sensible gains (other than mechanical ventilation gains) to voids and zones/rooms other than principal zones/rooms and their associated plenums. Calculated from the flowrate into and the temperature across the non-principle space. Any duct leakage sensible gain is deducted from this figure
|
|
Internal Gains:
Data
|
Notes
|
|
Lights
|
Lighting gain from the .cln file
|
|
People
|
People gain from the .cln file
|
|
Misc,Computers,Equip
|
Equipment gain from the .cln file
|
|
Mechanical Gains/Losses:
Data
|
Notes
|
|
Ventilation (sensible)
|
This is the net sensible heat added to the system by mechanical ventilation.
At zone level it is apportioned to the zone based on the proportion of sensible gains in the multiplex layer (all envelope, internal, non-principle, mechanical and the subject coil if it’s in the multiplex) compared to the sum of the gains for all layers.
At room level it is apportioned based on the airflow percentages from the Zone Airflow Distribution table (ZAD)
|
|
Transfer Air†
|
This is the gain attributable to the intake of air drawn from other spaces. As designated by the dagger symbol, Transfer Air is not reported in the Net Value column, as it is moving air and thus loads around within the scope of the peaking system coil loads. While transfer air does not contribute to net load for system-level coils, it may contribute to the net load in the case of zone level coils; however this has not yet been provided as a separate entry within the net value column for the reports
The contribution is calculated from the transfer air parameters (flow, transfer air temperature and room cooling setpoint) set in the relevant layer of the relevant system.
|
|
SA Duct Leakage†
|
This is the gain attributable to the additional load resulting from air leakage from supply ducts. As designated by the dagger, this is not reported in the Net Value column. If the peaking device is at zone or room level this parameter is not reported as contribution to supply air is assumed to be upstream of the zone coil.
The contribution is calculated from the leakage parameters (leakage %, flow, supply air temperature and room cooling setpoint) set in the relevant layer of the relevant system.
|
|
Fans
|
This is the heat gain from fans i.e. sensible gains from fans in the zone/room multiplex layer, plus a portion of gains from fans at system level all apportioned and aggregated.
The contribution is calculated from the fan parameters i.e. flow and temperature difference across the fan.
|
|
SA Duct (conduction)
|
This is the conduction heat gain to ducts (and thus to supply air on route to the subject space). This gain represents a transfer of heat to the system from a space (possibly the exterior space). If that space is in the same system, or the same zone, it will be balanced in the system or zone account by an equal loss from that space (part of the space’s ‘Duct conduction’ gain, see above). If the space is exterior or in a different system, the gain constitutes a net gain to the control volume.
The sensible gain is calculated from the temperature difference across the duct component and the mass flow entering it, as leakage is assumed to occur at the duct outlet.
|
|
Supply Air Plenum
|
This is the sensible gain to the supply air plenum if one exists.
The gain is calculated from flow and temperature difference characteristics (accounting for the duct conduction gain) as well as accounting for any leakage.
|
|
Room Units, Coils, etc.
|
Sensible gain from eligible components, other than the peaking device, in the zone/room multiplex layer, plus a portion of gains from components at the system level all apportioned and aggregated.
Eligible components are room units, Monodraught heater batteries, heating and cooling coils, Colorcoat Renew solar collectors, spray humidifiers (negative gain) and steam humidifiers (positive gain) and ducts.
|
|
Latent Cooling
|
The latent load on the cooling coil, taken the component output variable in the .cln file
|
|
Dehumid Oversizing†
|
This parameter is intended to report the additional coil capacity resulting specifically from the cooling of the supply air, as driven by system or zone setpoints for max RH, to a temperature below the SAT required for sensible space cooling, which is then followed immediately by reheating of the supply airflow to the SAT for space cooling. This added capacity for dehum followed by reheat (which may be accomplished by a heat pipe, runaround coil, or similar means between the AHU cooling and heating coils, with the heating coil as backup) is required to avoid overcooling any space already at min airflow as an unintended consequence of controlling humidity.
This should not be confused with the Latent Cooling parameter above. This is essentially AHU reheat load (reheat by AHU heating coil or other device immediately after the AHU cooling coil). This should be permitted only for sub-cooling the supply air to satisfy dehumidification requirements, as it would otherwise be a pointless waste of cooling and heating energy.
As designated by the dagger, this is not reported in the Net Value column.
|
|
Data
|
Notes
|
|
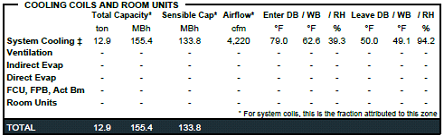
Total Capacity
|
This is the total capacity taken from the .asp file. In the case of evaporative cooling this is calculated from conditions in the .cln file
|
|
Sensible Capacity
|
This is the sensible capacity. The proportion of total to sensible is obtained from the .cln file and this is then applied to the total from the .asp to get the design sensible capacity
|
|
Airflow
|
This is the airflow from the .asp file. When the .asp is not a valid source it is taken from the .cln file
|
|
Entering DB/WB/RH
|
This is the entering conditions from the .asp file. When the .asp is not a valid source the values are taken from the .cln file
|
|
Leaving DB/WB/RH
|
This is the leaving conditions from the .asp file. When the .asp is not a valid source the values are taken from the .cln file
|
|
Data
|
Notes
|
|
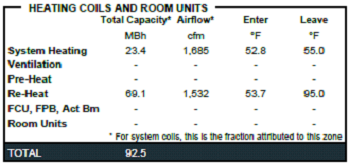
Total Capacity
|
This is the total capacity taken from the .asp file
|
|
Airflow
|
This is the airflow from the .asp file. When the .asp is not a valid source it is taken from the .htn file
|
|
Entering DB
|
This is the entering dry bulb from the .asp file. When the .asp is not a valid source the values are taken from the .htn file
|
|
Leaving DB
|
This is the leaving dry bulb from the .asp file. When the .asp is not a valid source the values are taken from the .htn file
|
|
Data
|
Description
|
|
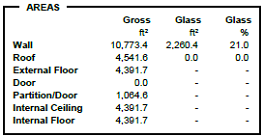
Wall
|
External wall area + external glazing area (excluding doors and holes)
External glass area in associated wall as area and percentage of gross wall area
|
|
Roof
|
External roof area + external skylight area (excluding holes)
External skylight area in associated roof as area and percentage of gross roof area
|
|
External Floor
|
Area of ground and exposed floors
|
|
Door
|
External door area
|
|
Partition/Door
|
Internal vertical partition and door area (including glazing & holes)
|
|
Internal Ceiling
|
Internal ceiling area
|
|
Internal Floor
|
Internal floor area
|
|
Data
|
Description
|
|
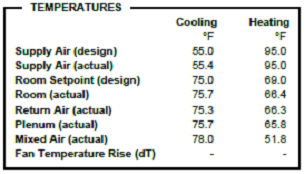
Supply air (design)
|
This is the system level design temperature and is obtained from the systems parameters UI for heating and cooling as follows:
· If a Packaged terminal unit or single zone this is taken from the ‘Zone loads & airflows tab’ (cooling and heating design zone air temperatures)
· If a non-DOAS system this is taken from the System Parameters dialog in SP. (Cooling - ‘System min SAT for space cooling & vent tempering’, Heating - ‘Heating mode max SAT’)
· If DOAS then it references ‘DOAS ventilation air tempering max SAT (subject to SAT reset) for cooling and ‘DOAS ventilation air tempering min SAT’ for heating.
|
|
Supply air (actual)
|
The actual system supply temperature is obtained from the .cln and .htn respectively. This is determined by querying the following nodes:
· Packaged and single zone systems: node entering the room/zone
· All other system: node just before the multiplex boundary
|
|
Return air (actual)
|
The actual system return temperature is obtained from the .cln and .htn respectively. This is determined by querying the following nodes:
· Packaged and single zone systems: node leaving the room/zone
· All other system: node to the RHS of the RA damper
|
|
Plenum (actual)
|
Not applicable at system level therefore is shown as a dash (-)
|
|
Mixed air (actual)
|
The actual system mixing temperature is taken from the .cln and .htn and references the mixing damper outlet node.
|
|
Fan Motor Temp Rise (dT)
|
This is the temperature rise due to the motor and is given by:
Where,
|
|
Fan Blade Temp Rise (dT)
|
This is the heat rise due to the fan (everything that isn’t the motor and the drive mechanism) and is given by:
Where -
|
|
Fan Configuration
|
This is determined based on the relative location of the system cooling coil and the supply fan, see section 3.2 for further information
|
|
Zone level:
Note, where appropriate the data source is at the time of peak zone cooling and heating loads, respectively (coincident peak value for all rooms in each zone).
Data
|
Description
|
|
Supply air (design)
|
This is the zone level design temperature and is obtained from the system parameters UI for heating and cooling (‘Zone loads & airflows tab’ - cooling and heating design zone air temperatures)
|
|
Supply air (actual)
|
The actual zone supply temperature is obtained from the .cln and .htn. This is determined by querying the node entering the zone
|
|
Return air (actual)
|
The actual zone return temperature is obtained from the .cln and .htn. This is determined by querying the node leaving the zone
|
|
Plenum (actual)
|
This is the actual plenum temperature obtained from the .cln and .htn. This is determined by querying the node directly downstream of the plenum component
|
|
Mixed air (actual)
|
Same as the system mixing temperature
|
|
Zone Fan Temp Rise (dT)
|
This parameter is shown only when there is a zone-level fan, such as in a fan-coil unit or FPB.
At zone level the reports show the complete fan temp rise which is obtained from the .cln and .htn file
|
|
Room level:
Note, where appropriate the data source is at the time of peak room cooling and heating loads, respectively.
Data
|
Description
|
|
Supply air (design)
|
This is the room level design temperature and is obtained from the systems parameters UI for heating and cooling (‘Zone loads & airflows tab’ - cooling and heating design zone air temperatures). Note that for rooms in zones, this is the same for each room.
|
|
Supply air (actual)
|
The actual room supply temperature is obtained from the .cln and .htn. This is determined by querying the node entering the room. Note that for rooms in zones, this is the same for each room.
|
|
Room Setpoint (design)
|
This is obtained from the ‘Systems Schedules and Setpoints’ dialog
|
|
Room throttling range
|
This is currently blank (not reported) and may be included in future versions
|
|
Room (actual)
|
The room temperature is obtained from the .cln and .htn
|
|
Return air (actual)
|
The actual room return temperature is obtained from the .cln and .htn. This is determined by querying the node leaving the room. Note that for rooms in zones, this is the same for each room.
|
|
Plenum (actual)
|
This is the actual plenum temperature obtained from the .cln and .htn. This is determined by querying the node directly downstream of the plenum component. Note that for rooms in zones, this is the same for each room.
|
|
Mixed air (actual)
|
Same as the system mixing temperature
|
|
Zone Fan Temp Rise (dT)
|
This parameter is shown only when there is a room-level fan, such as in a fan-coil unit or FPB.
This is not applicable for rooms in zones and is therefore a dash (-). At room level the reports show the complete fan temp rise which is obtained from the .cln and .htn file.
|
|
Data
|
Description
|
|
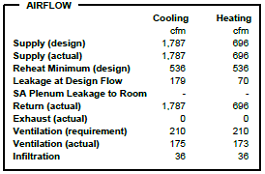
Supply (design)
|
This is the system level design airflow and is obtained from the system parameters UI for heating and cooling (‘Zone loads & Supply Airflows tab’ for package and single zone systems or ‘System supply fan design flow rate, Vpsd’ for all other systems)
|
|
Supply (actual)
|
The actual system supply airflow is obtained from the .cln and .htn respectively. This is determined by querying the following nodes:
· Packaged and single zone systems: node entering the room/zone
· All other systems: node just before the multiplex boundary
These will normally be coincident with the time system-level coincident peak cooling and heating loads for all zones, respectively. There are certain cases for particular systems, control schemes, and climates, however, wherein the greatest system airflow in either Cooling or Heating mode will be required at a point in time that does not coincide with the peak loads for one or both of these operating modes. The reported values will always be the maximum airflow recorded during the Cooling and Heating design sizing runs, respectively, regardless of coincidence with peak loads
|
|
Reheat Minimum (design)
|
This is the minimum primary airflow for each zone, obtained from the system parameters UI, summed to get the system value
|
|
Leakage at Design Flow
|
This is the zone leakage airflow, which is obtained by multiplying the percentage leakage by the zone supply design flow and summed to get the system value. If the leakage occurs at system level then this is calculated with system values.
|
|
Return (actual)
|
The actual system return airflow is obtained from the .cln and .htn respectively. This is determined by querying the following nodes:
· Packaged and single zone systems: node leaving the room/zone
· All other system: node to the RHS of the RA damper
|
|
Exhaust and Relief (actual)
|
This is the flow out of all the system outlets summed
|
|
Ventilation (requirement)
|
This is the system ventilation requirement and is taken from the System Parameters dialog (‘System minimum outdoor air intake, ‘Vot/make-up’)
|
|
Ventilation (actual)
|
This is the actual system ventilation and is obtained from the .cln and .htn respectively. The source of this data varies depending on the system configuration i.e.
· DOAS - Heat recovery bypass damper outlet if present, else the system air inlet
· Package terminal unit and single zone - Multiplex boundary node for incoming outdoor air supply. The ‘system’ in this case is the same as the zone. There may not be an actual ‘inlet’ component if the user has coupled the PTAC/PTHP inlet to another system
· Mixing Systems - Flow rate at heat recovery bypass damper outlet if present, else OA Economizer damper inlet if present
Note that a flag has been provided to indicate DCV. This uses dynamic text to append ‘– DCV’ to the ‘Ventilation (actual)’ label, so that this would read ‘Ventilation (actual) – DCV’ for any system with DCV
|
|
Infiltration
|
The infiltration rate for all room/zones is obtained from the .cln and .htn and summed to give the system level value
|
|
Zone level:
Note, where appropriate the data source is at the time of peak zone cooling and heating loads, respectively (coincident peak value for all rooms in each zone)
Data
|
Description
|
|
Supply (design)
|
This is the zone level design airflow and is obtained from the system parameters UI for heating and cooling. (‘Zone loads & Supply Airflows tab’)
|
|
Supply (actual)
|
This is the actual system supply airflow into the zone and is obtained from the .cln and .htn. This is determined by querying the node entering the zone
|
|
Reheat Minimum (design)
|
This is the minimum primary airflow for the zone, obtained from the system parameters UI
|
|
Leakage at Design Flow
|
This is the zone leakage airflow and is obtained by multiplying the percentage leakage by the supply design flow
|
|
Return (actual)
|
This is the actual zone return airflow and is obtained from the .cln and .htn. This is determined by querying the node leaving the zone
|
|
Exhaust (actual)
|
This is the flow on the zone exhaust path obtained from the .cln and .htn respectively
|
|
Ventilation (requirement)
|
This is the zone ventilation requirement and is taken from the system parameters dialog (‘Max req.’ from the ‘Zone Ventilation & Exhaust’ tab)
|
|
Ventilation (actual)
|
This is the actual zone ventilation and is obtained from the .cln and .htn respectively. The source of this data varies depending on the system configuration i.e.
· DOAS - Flow at node for controller with ‘DOAS Vent Airflow’ or ‘DOAS Vent Airflow CAV/DCV’ link
· Package terminal unit and single zone - Flow rate at multiplex boundary node for incoming outdoor air supply. This may not be an actual ‘inlet’ component if the user has coupled the PTAC/PTHP inlet to another system
· Mixing Systems - Flow is determined by determining the system OA fraction (OA flow rate system level divided by total system supply flow rate). This is then multiplied by the zone supply (actual) peak airflow to get the ventilation actual flow to the zone
Note that a flag has been provided to indicate DCV. This uses dynamic text to append ‘– DCV’ to the ‘Ventilation (actual)’ label, so that this would read ‘Ventilation (actual) – DCV’ for any system with DCV
|
|
Infiltration
|
This is the infiltration rate for the zone and is obtained from the .cln and .htn
|
|
Room level:
Note, where appropriate the data source is at the time of peak room cooling and heating loads, respectively. In addition, for rooms in zones the zone flow is distributed among the rooms as per the proportioning in the zone airflow distribution table (ZAD)
Data
|
Description
|
|
Supply (design)
|
This is the room level design airflow and is obtained from the system parameters UI for heating and cooling. (‘Zone loads & Supply Airflows tab’)
|
|
Supply (actual)
|
This is the actual system supply airflow into the room and is obtained from the .cln and .htn. This is determined by querying the node entering the room
|
|
Reheat Minimum (design)
|
This is the minimum primary airflow for the room, obtained from the system parameters UI
|
|
Leakage at Design Flow
|
This is the room leakage airflow and is obtained by multiplying the percentage leakage by the supply design flow.
|
|
Return (actual)
|
This is the actual room return airflow and is obtained from the .cln and .htn. This is determined by querying the node leaving the room
|
|
Exhaust (actual)
|
This is the flow on the room exhaust path obtained from the .cln and .htn respectively
|
|
Ventilation (requirement)
|
This is the room ventilation requirement and is taken from the system parameters dialog (‘Max req.’ from the ‘Zone Ventilation & Exhaust’ tab).
|
|
Ventilation (actual)
|
This is the actual room ventilation and is obtained from the .cln and .htn respectively. The source of this is the same as for zones.
|
|
Infiltration
|
This is the infiltration rate for the room and is obtained from the .cln and .htn
|
|
Data
|
Description
|
|
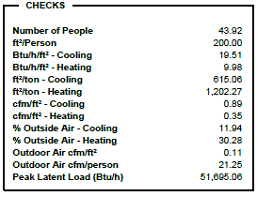
Number of people
|
Sourced from the system parameters UI for each zone and summed to get the value at system level. (Zone airflow, turndown & engineering checks tab).
In the case of rooms within zones the value is taken directly from the room.
|
|
ft2/person
|
Sourced from the system parameters UI for each zone (Zone airflow, turndown & engineering checks tab). This data is then used to calculate system level value.
In the case of rooms within zones the value is calculated directly from room parameters (room floor area and peak occupancy)
|
|
Btu/hr.ft2 – Cooling & Heating
|
Sourced from the system parameters UI for each zone (Zone airflow, turndown & engineering checks tab). This data is then used to calculate system level value.
In the case of rooms within zones the value is calculated directly from room parameters (room load from the Zone Airflow Distribution table (ZAD) and room floor area)
|
|
ft2/ton – Cooling & Heating
|
Sourced from the system parameters UI for each zone (Zone airflow, turndown & engineering checks tab). This data is then used to calculate system level value.
In the case of rooms within zones the value is calculated directly from room parameters (room load from the Zone Airflow Distribution table (ZAD) and room floor area)
|
|
cfm/ft2 – Cooling & Heating
|
Sourced from the system parameters UI for each zone (Zone airflow, turndown & engineering checks tab). This data is then used to calculate system level value.
In the case of rooms within zones the value is calculated directly from room parameters (room airflow from the Zone Airflow Distribution table (ZAD) and room floor area)
|
|
% Outdoor Air - Cooling & Heating
|
Sourced from the system parameters UI for both zone and system level (Zone airflow, turndown & engineering checks tab).
At room level the necessary parameters required to calculate % outdoor air are taken from the Zone Airflow Distribution table (ZAD) (ventilation and room airflow)
|
|
Outdoor air cfm/ft2
|
Sourced from the system parameters UI for system level (Zone airflow, turndown & engineering checks tab).
At zone and room level the outdoor air flow is taken from the Zone Airflow Distribution table (ZAD) (ventilation airflow) and along with floor area is used to calculate the required values.
|
|
Outdoor air cfm/person
|
Sourced from the system parameters UI for system level (Zone airflow, turndown & engineering checks tab).
At zone and room level the outdoor air flow is taken from the Zone Airflow Distribution table (ZAD) (ventilation airflow) and along with No. of people is used to calculate the required values.
|
|
Peak latent Load (Btu/h)
|
This value is determined based on the peak Latent Load at the system cooling coil (independent of the overall cooling coil peak) and is distributed out to the zone and room as per the proportioning in the Zone Airflow Distribution table (ZAD)
|
