The flow through each opening is calculated as a function of imposed pressure difference and the characteristics of the opening. These characteristics differ for cracks and larger openings.
Flow Characteristics for Cracks
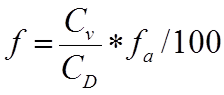
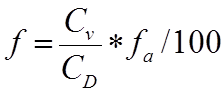
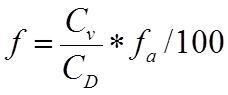
For a crack the dependence of flow on pressure difference is assumed to take the form
(7)
where

is the air flow through the crack (l/s)

is the Crack Flow Coefficient (l s
-1 m
-1 Pa
-0.6 )

is the length of the crack (m)

is the density of air entering the crack (kg/m
3 )

= 1.21 kg/m
3 is a reference air density

is the pressure difference across the crack (Pa).
Equation 7 represents a best fit to a large range of experimental data analysed by the Air Infiltration and Ventilation Centre [1]. In this treatment the expression has been generalised on dimensional grounds by introducing a dependence on air density.
Representative measured values of the Crack Flow Coefficient for windows and doors are given in Table 3 and Table 4. These values are taken from [1].
Table 3 Crack Flow Coefficients (l s -1 m -1 Pa -0.6 ) – Windows
|
|
Lower Quartile
|
Median
|
Upper Quartile
|
|
Windows (Weatherstripped)
Hinged
Sliding
|
0.086
0.079
|
0.13
0.15
|
0.41
0.21
|
|
Windows (Non-weatherstripped)
Hinged
Sliding
|
0.39
0.18
|
0.74
0.23
|
1.1
0.37
|
Table 4 Crack Flow Coefficients (l s -1 m -1 Pa -0.6 ) – Doors
|
|
Lower Quartile
|
Median
|
Upper Quartile
|
|
External Doors (Weatherstripped)
Hinged
Revolving
|
0.082
1.0
|
0.27
1.5
|
0.84
2.0
|
|
External Doors (Non-weatherstripped)
Hinged
Sliding
|
1.1
|
1.2
0.2
|
1.4
|
|
Internal Doors (Non-weatherstripped)
|
1.1
|
1.3
|
2.0
|
|
Loft Hatches (Non-weatherstripped)
|
0.64
|
0.68
|
0.75
|
Flow Characteristics for Large Openings
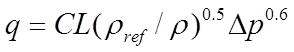
For large openings such as open windows the flow characteristics has the pressure dependence
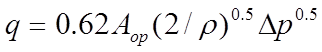
(8)
where

is the discharge coefficient for flow through the opening

is the air flow through the opening (m
3 /s)

is the open area of the opening (m
2 )

is the density of air entering the opening (kg/m
3 )

= 1.21 kg/m
3 is a reference air density
is the pressure difference across the opening (Pa).
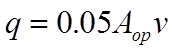
The open area of the opening in general varies in time, and is calculated as follows:
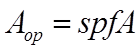
(9)
where

is the area of the opening (m
2 ) as drawn in ModelIT

is the equivalent area fraction - the maximum equivalent area of the opening available for air flow expressed as a fraction of A

is the degree of opening – a time-varying profile that indicates the fractional
extent to which the window is open at any given time (subject to the control signal s)

is a control signal relating to the (optional) control of window opening in response to room temperature
The variables p and s relate to the parameters Degree of Opening and Threshold Temperature set in the MacroFlo Opening Types Manager program.
Degree of Opening (% Profile) is a percentage profile allowing the degree of window or door opening to be specified as a function of time. Subject to the Temperature Threshold control, the area of the opening will be varied by modulating the Openable Area with the Degree of Opening percentage profile. When the Degree of Opening profile is zero, or when the Threshold Temperature control dictates that the window or door is closed, the opening will be treated as a crack.
Threshold Temperature (ºC) allows for window opening to be controlled on the basis of room temperature. Threshold Temperature is the temperature in the room adjacent to the opening which, when exceeded, will trigger the opening of the window or door. Once open, it will remain so (possibly in varying degrees) until the Degree of Opening percentage profile falls to zero, regardless of subsequent values of the adjacent room air temperature. A low value for Threshold Temperature (for example 0ºC) will ensure that the pattern of opening simply follows the Degree of Opening percentage profile.
The discharge coefficient (0.62) used in equation 8 is appropriate for openings that are small in relation to the adjacent spaces. Where this is not the case, adjustments to opening areas may be appropriate. See section 7 Techniques for Modelling Flow in Facades.
Equivalent Area Fraction
The equivalent area fraction is calculated depending on the category of opening selected and related variables input.
Users should be clear about the meaning of equivalent area as these terms are often loosely defined; a list of definitions is provided below and how they are applied in the <VE>:
· The structural opening area : the area of the "hole in the wall" required to fit the window or louvre/grille. In the <VE> the user can draw a notional window (of which a sub-area(s) maybe openable) or individually draw each opening leaf. The user can use the MacroFlo Openable area % input to allow for non-openable portions or frame area on individual leafs etc.
· The geometric area: the area of the opening through a ventilator, measured in the plane defined by the surface of the construction works, where it contacts the structure of the ventilator. No reduction will be made for controls, louvers or other obstructions.
· The aerodynamic area : a measure of the aerodynamic performance of a ventilator. This the product of the geometric area multiplied by the coefficient of discharge of the ventilator (Cv).
· The equivalent area : It is the area of a sharp edged orifice through which air would pass at the same volume flow rate, under an identical applied pressure difference, as the opening under consideration. Typically for windows even when fully open the opening will perform with a higher pressure drop than a sharp edged orifice. For window, door and grille/louvre opening categories in MacroFlo this is given by the aerodynamic area divided by the coefficient of discharge for a sharp edge orifice (CD = 0.62).
These definitions are consistent with definitions used by the UK Building Regulations and window manufacturers.
Note: geometric free area is not the same as aerodynamic or equivalent area – it usually defines the smallest area through which air can pass and unlike aerodynamic or equivalent area does not describe the actual pressure relationship of the opening.
The default selections provided utilise real opening test data in order to ensure realistic real world performance in <VE> models.
Custom/Sharp Edge Orifice
where:

is the openable area %
All Hung Windows / Doors
where:

is a discharge coefficient interpolated from the table below.
CD is the discharge coefficient for a sharp edge orifice (0.62)

is the openable area %
Window performance data has been collated from manufacturer’s test data.
Factors Calculations:
|
Side hung window / door:
|
Proportions
|
|
|
L/H < 0.5
|
0.5 = L/H <1
|
1 = L/H <2
|
L/H > 2
|
|
|
|
|
|
|
|
Opening angle deg
|
Cv
|
Cv
|
Cv
|
Cv
|
|
10
|
0.1
|
0.17
|
0.24
|
0.34
|
|
20
|
0.22
|
0.31
|
0.39
|
0.51
|
|
30
|
0.36
|
0.43
|
0.5
|
0.6
|
|
45
|
0.5
|
0.54
|
0.64
|
0.65
|
|
60
|
0.58
|
0.6
|
0.63
|
0.67
|
|
90
|
0.64
|
0.65
|
0.65
|
0.67
|
|
Centre hung window:
|
Proportions
|
|
|
L/H = 1
|
L/H > 2
|
|
|
|
|
|
Opening angle deg
|
Cv
|
Cv
|
|
15
|
0.15
|
0.13
|
|
30
|
0.30
|
0.27
|
|
45
|
0.44
|
0.39
|
|
60
|
0.56
|
0.56
|
|
90
|
0.64
|
0.61
|
|
Top hung window:
|
Proportions
|
|
|
L/H < 0.5
|
0.5 = L/H <1
|
1 = L/H <2
|
L/H > 2
|
|
|
|
|
|
|
|
Opening angle deg
|
Cv
|
Cv
|
Cv
|
Cv
|
|
10
|
0.34
|
0.24
|
0.17
|
0.1
|
|
20
|
0.52
|
0.39
|
0.3
|
0.23
|
|
30
|
0.6
|
0.5
|
0.43
|
0.36
|
|
45
|
0.65
|
0.58
|
0.54
|
0.5
|
|
60
|
0.67
|
0.63
|
0.6
|
0.58
|
|
90
|
0.68
|
0.65
|
0.65
|
0.64
|
|
Btm hung window:
|
Proportions
|
|
|
L/H < 0.5
|
0.5 = L/H <1
|
1 = L/H <2
|
L/H > 2
|
|
|
|
|
|
|
|
Opening angle deg
|
Cv
|
Cv
|
Cv
|
Cv
|
|
10
|
0.27
|
0.23
|
0.15
|
0.09
|
|
20
|
0.53
|
0.42
|
0.26
|
0.16
|
|
30
|
0.62
|
0.52
|
0.37
|
0.26
|
|
45
|
0.67
|
0.62
|
0.53
|
0.46
|
|
60
|
0.69
|
0.66
|
0.61
|
0.57
|
|
90
|
0.72
|
0.69
|
0.67
|
0.64
|
|
Parallel hung window:
|
Proportions
|
|
|
L/H = 1
|
L/H = 2
|
L/H > 2
|
|
|
|
|
|
|
Opening angle deg
|
Cv
|
Cv
|
Cv
|
|
15
|
0.23
|
0.15
|
0.13
|
|
30
|
0.40
|
0.30
|
0.24
|
|
45
|
0.51
|
0.41
|
0.34
|
|
60
|
0.57
|
0.50
|
0.43
|
|
90
|
0.65
|
0.60
|
0.60
|
Window – Sash and Sliding / Roller Door
where:
is a coefficient (fixed at 0.65 for a fully open window)
CD is the discharge coefficient for a sharp edge orifice (0.62)
is the openable area %
Louvre, Grille and Acoustic Duct
where:

is a product coefficient of discharge (in effect replacing the MacroFlo ideal Cd value). This value may be input based on product information or for ducts can be calculated based on specification of duct length and selection of type.
CD is the discharge coefficient for a sharp edge orifice (0.62)
is the openable area %
is calculated depending on the defined Duct Length and type, it assume s:
· CIBSE pressure loss factors for fittings
· CIBSE pressure loss factors for entry / exits and mesh grilles
· A notional velocity to determine a typical

value
In the case of acoustic ducts typical pressure loss performance values have been taken from real manufacturers data, however it should be borne in mind that acoustic duct inserts vary hugely.
Variation of Opening Flow with Height
The dependence of the buoyancy pressures with height means that equations 7 and 8 must be applied separately to each of a series of infinitesimally narrow horizontal slices of the opening.
Equations 7 and 8 then become
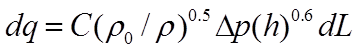
(10)
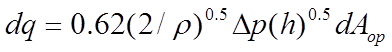
(11)
and the expressions for total volume flow are calculated by integrating over height. The height integral is performed using geometrical data passed from ModelIT.
Quite commonly a change of sign in the pressure difference occurs part-way up the opening. Either side of this height (known as the neutral pressure plane) the air flows in opposite directions. In this situation MacroFlo performs a separate calculation for the volume flow in the two directions.
Wind Turbulence
The theory described above ignores the variation in pressure due to wind turbulence. This tends to increase flows through external openings, particularly in the case of single-sided ventilation.
An allowance for this effect is made using an equation provided in CIBSE Applications Manual AM10 [3] based on the work of Warren and Parkins [4]. AM10 provides the following formula for flow through an external opening due to wind turbulence:
(12)
where the symbols have the meanings previously defined.
This formula has been generalised for use in MacroFlo to include the effects of: exposure type, stack pressure, cross ventilation, ventilation driven by mechanical ventilation and to cover flow through cracks.
The wind turbulence effect is modelled as a variation of wind pressure across the opening around the value calculated from the wind pressure coefficient. The pressure variation is set in such a way as to reproduce the AM10 flow in cases where wind turbulence is the dominant driving force.
This pressure variation is modelled by dividing the opening laterally into four sections and applying pressure adjustments to each. The fractional areas and pressure adjustments for each section are as follows:
|
Section
|
1
|
2
|
3
|
4
|
|
Fractional area
|
0.3
|
0.2
|
0.2
|
0.3
|
|
Pressure adjustment
|
-0.04138 pref
|
-0.00963 pref
|
0.00963 pref
|
0.04138pref
|
Here

is a reference wind pressure (Pa), calculated from
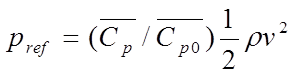
(13)
where an adjustment for exposure type has been made using

the angle-averaged wind pressure coefficient for the opening, and

the angle-averaged wind pressure coefficient for an opening of type ‘exposed wall’.
Flow calculations are performed separately for each of the four sections of the opening.
The parameters in this 4-term treatment of wind turbulence have been chosen to provide a good approximation to results from an integration-based treatment which effectively uses an infinite number of terms.
Pressure adjustments of the same kind are applied to the calculation of crack flow.
Rayleigh Instability
A special situation arises where a horizontal opening, such as a stair well, has warm air beneath it and cool air above it. In this situation, known as the Rayleigh instability, the theory presented thus far predicts that no air will flow through the opening, since it assumes uniform pressure across the opening. In practice, however, warm air from below will rise through one side of the opening while cool air descends through the other side.
To model the Rayleigh instability, MacroFlo tests for conditions such as those described above and applies a modified form of the theory based on the behaviour of plumes [5].