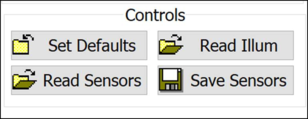
Sensor positions can be saved in a .sen file using the Save Sensors button and reloaded using Read Sensors.
The Set Defaults button opens the default sensor placement window mentioned earlier.
Return to the Simulate tab to run a sensors type simulation. Once the simulation is complete, the Read Illum button is used to view the sensor simulation results files (.ill or .ril files created by a sensor simulation.)
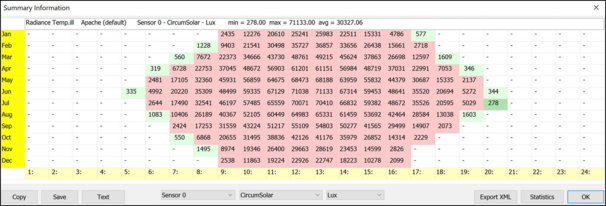
The data will be displayed as a table, showing the illumination measurements made by the sensor.
Illuminance values over certain thresholds are highlighted as below:
white
green
Red
Lux
< 100
100-2000
> 2000
Foot-Candles
< 10
10-200
> 200
There are drop-boxes in this table to select the sensor, the unit of measurement and type of sky for which results are to be displayed. Sensor 0 is an unobstructed sensor placed outside the building which is provided for reference.
The statistics button will open a text file of all results, using the selected units.
The Copy and Text buttons will copy the grid image or grid text to the clipboard. The data can then be pasted into a report or spreadsheet for further edit.
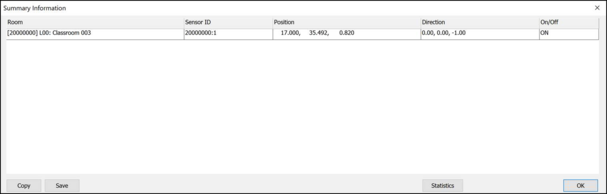
The Summary button on the Sensor Settings tab provides a table showing current sensor settings and positions:
Sensors that have been switched off are highlighted in grey.
This table can be copied to the clipboard or saved as a .bmp file. The Statistics button creates a .txt file with the total number of sensors, their status (on/off) and their respective spaces.