The Refresh Display button is used to refresh the view when the thresholds are edited.
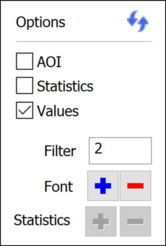
The AOI checkbox changes the view to display results for the Area of Interest.
If plan view is selected, the statistics option becomes available. This displays the results statistics.
The Values checkbox shows/hides the grid values (this can be useful where the grid is very dense).
The filter input box changes the number of grid points displayed. 1 will show every grid point, 2 every second point, etc. 0 will disable the values.
The + and - buttons are used to change the font size of the grid values and the statistics displayed in the view.
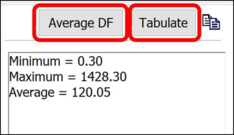
The Average Daylight Factor (DF) button will generate a report in the Content Manager, showing Daylight Factor statistics for the space. This is only applicable for WP Zone Data (Dynamic) simulations.
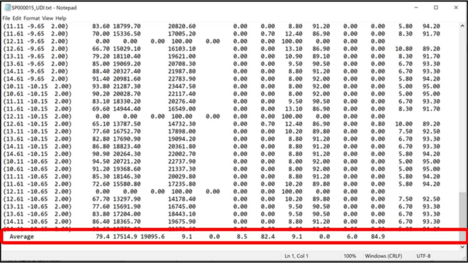
The Tabulate button creates a text file showing the results for each grid point with a separate column for each result set for the selected file. It also calculates the average for each column.
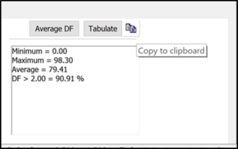
The Copy to Clipboard button copies the results view and statistics to the clipboard for subsequent pasting.