The intelligent Virtual Network (iVN) is a high-level district modelling tool for performing simulations of city/community-level energy distribution networks using a combination of accounting, physics and engineering concepts, such as energy conservation and power-flow analysis.
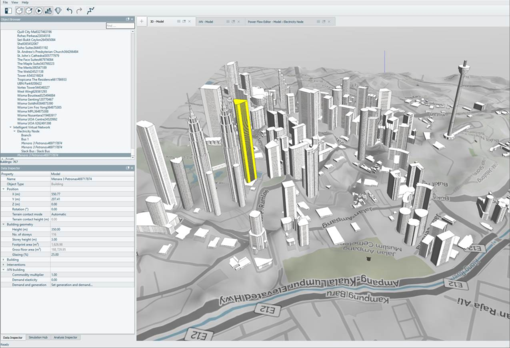
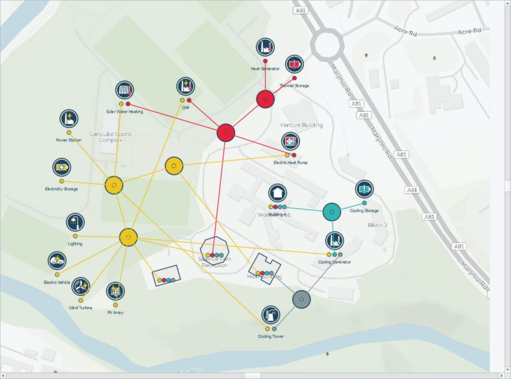
The iVN uses a combination of 3D building geometry models (see Figure 1-1) and 2D schematic tools (see Figure 1-2) to model city infrastructure. It can then perform simulations which aggregate the demand for particular commodities, such as electricity and heat, and allocate loads to providers in order to meet the demand. The iVN can also simulate the performance of PV panels, wind turbines and other renewable energy technologies, perform energy balance calculations, take into account storage devices, track the use of fuels and other commodities and calculate CO2 emissions associated with direct consumption of fuels and indirect consumption of electricity, heat, and cooling.
The purpose of the iVN is to calculate high-level estimations of the current performance of various utilities and quantitatively predict the impact of changes to city-infrastructure. The following are a small sample of the questions that the IVN can address:
· What is the impact of replacing a coal-fired power station with a Combined-Cycle Gas Turbine (CCGT) power station? What is the reduction in CO2 emissions and will alternative energy supplies be required to meet demand?
· What is the total reduction in carbon emissions associated with installing solar panels on every home in a particular suburb? What is the performance of the solar panels based on the particular weather found at the location of the city/district?
· How capable is an electrical storage device in meeting peak demand when energy provision is lower than the demand?
· What is the impact of an additional suburb on the existing power grid or district heating network?
· Can existing utilities manage an increase in demand within existing constraints? If not, what changes to energy storage or local generation are required to achieve this?
· What is the impact of building energy efficiency improvements (such as insulation, double-glazing or efficient central heating) on the electricity grid or district heating demand?
Figure 1-1: The 3D model view workspace, primarily used to display and edit building geometry
Figure 1-2: A 2D iVN network workspace, showing a sample iVN network with multiple installations connected by nodes