Data visualization is often underestimated. It is not just interesting images for reports and presentations. It provides insights through analysis and is critical to helping people understand complex information.
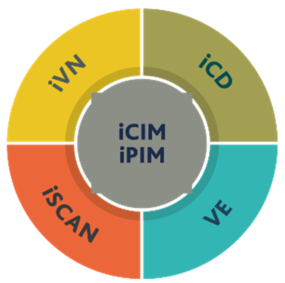
iPIM or Portfolio Information Model is a building portfolio and asset management tool for the visualization of key performance indicators and data. The tool can be used to manage a Portfolio across any geographical scale – Global, Continent, Country, City, and Campus.
It can be used to:
- Identify data patterns, make connections
- Map resources and cost impacts
- Map view, filter, data interrogation and trend tools