2.3. Energy, solar, PV, water, accessibility assessments and simulations
Based on its nature, the data once assigned can undergo various level of assessments. The different types of assessments possible in the iCD tool are discussed below.
2.3.1. Energy
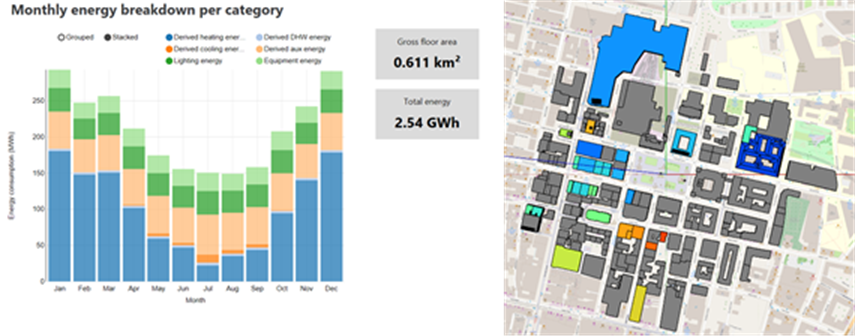
Basic energy simulations can be quickly performed to assess a single building or multiple buildings based on the data assigned in the previous steps.
In this assessment, the impact on the individual building energy use can be evaluated by considering aspects such as over-shading from neighbouring buildings.
Figure 2-3: Simulation results displayed in the energy report (left) and with the Visualisation tool (right)
2.3.2. Solar Analysis and PV (renewables)
Photovoltaic (PV) potential can be estimated across the community by using the solar assessment tool, located in the iCD extensions tab.
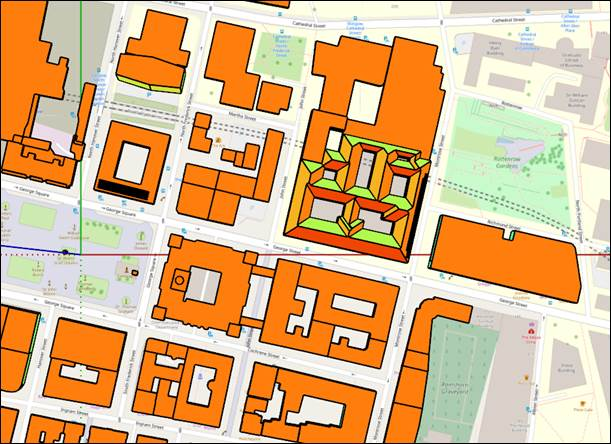
The visualisation tool allows then to identify the most exposed area which would be ideal for PV installations.
The solar insolation visualization gives the best potential locations on the building for PV installations, based on the amount of incident sunlight.
Figure 2-4: Solar insolation per square meter visualisation
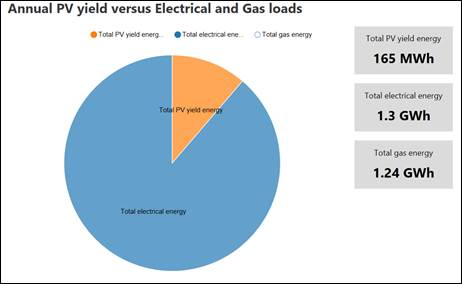
The PV panel array installations, through the create tool, can generate annual PV energy yield which can be visualized in Reports.
Figure 2-5: Pie chart showing the PV energy production compared to site electrical consumption
2.3.3. Water Analysis
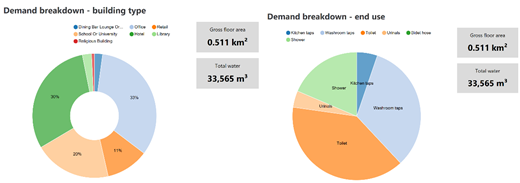
In iCD, water consumption can be assessed based on the building type’s default or customizable water fixtures flowrates. Water analyses in iCD also include a calculation of rainwater runoffs.
Figure 2-6: Pie chart showing water demand breakdown by its building type and end-use
2.3.4. Walkability Assessment
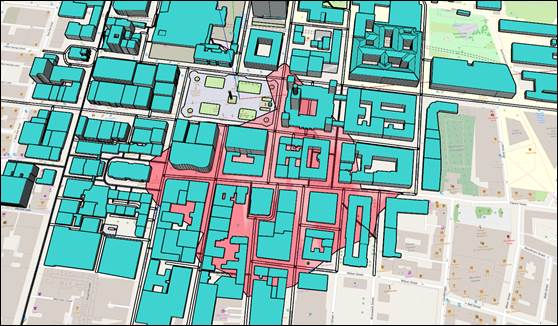
iCD allows to perform a Walkability Assessment which shows the area covered under a given walking distance to a point in the model. The assessment is run by having the roads and pavements in place in the model through the OSM imports and defining/generating the walkability boundary extents in the boundary tool.
Figure 2-7: Walkability assessment boundary
2.3.5. Accessibility Assessment
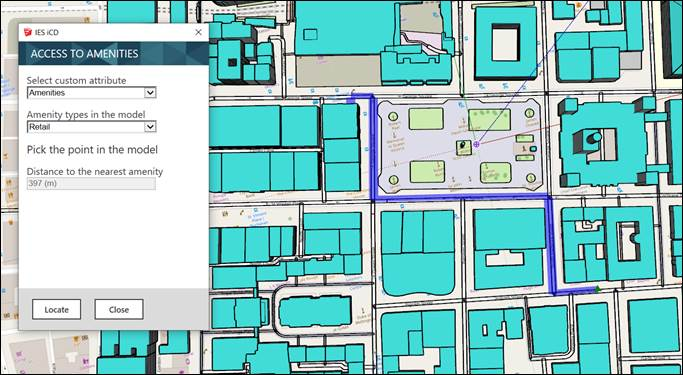
Proximity to necessary amenities and services is very crucial for buildings in an urban development. Accessibility tool enables the measurement of distances to these amenities or services.
Figure 2-8: Accessibility Assessment. It shows the way between a selected point and the nearest chosen amenity
A list of amenities can be added in the iCD model. Once done, the Accessibility Assessment allows the end user to evaluate the physical distance between a chosen location and each amenity type.
Like in the walkability, roads and pavement should be modelled for this tool to run.